Visualizing Progress
Growing the Region, One Investment at a Time


Visualizing Progress
Growing the Region, One Investment at a Time
Depicting capital projects and assets across the 15-county bi-state St. Louis metro and visualizing the geography of economic transformation and growth, all thanks to a collaborative regional effort.
Learn more about the map, methodology, and data sources.
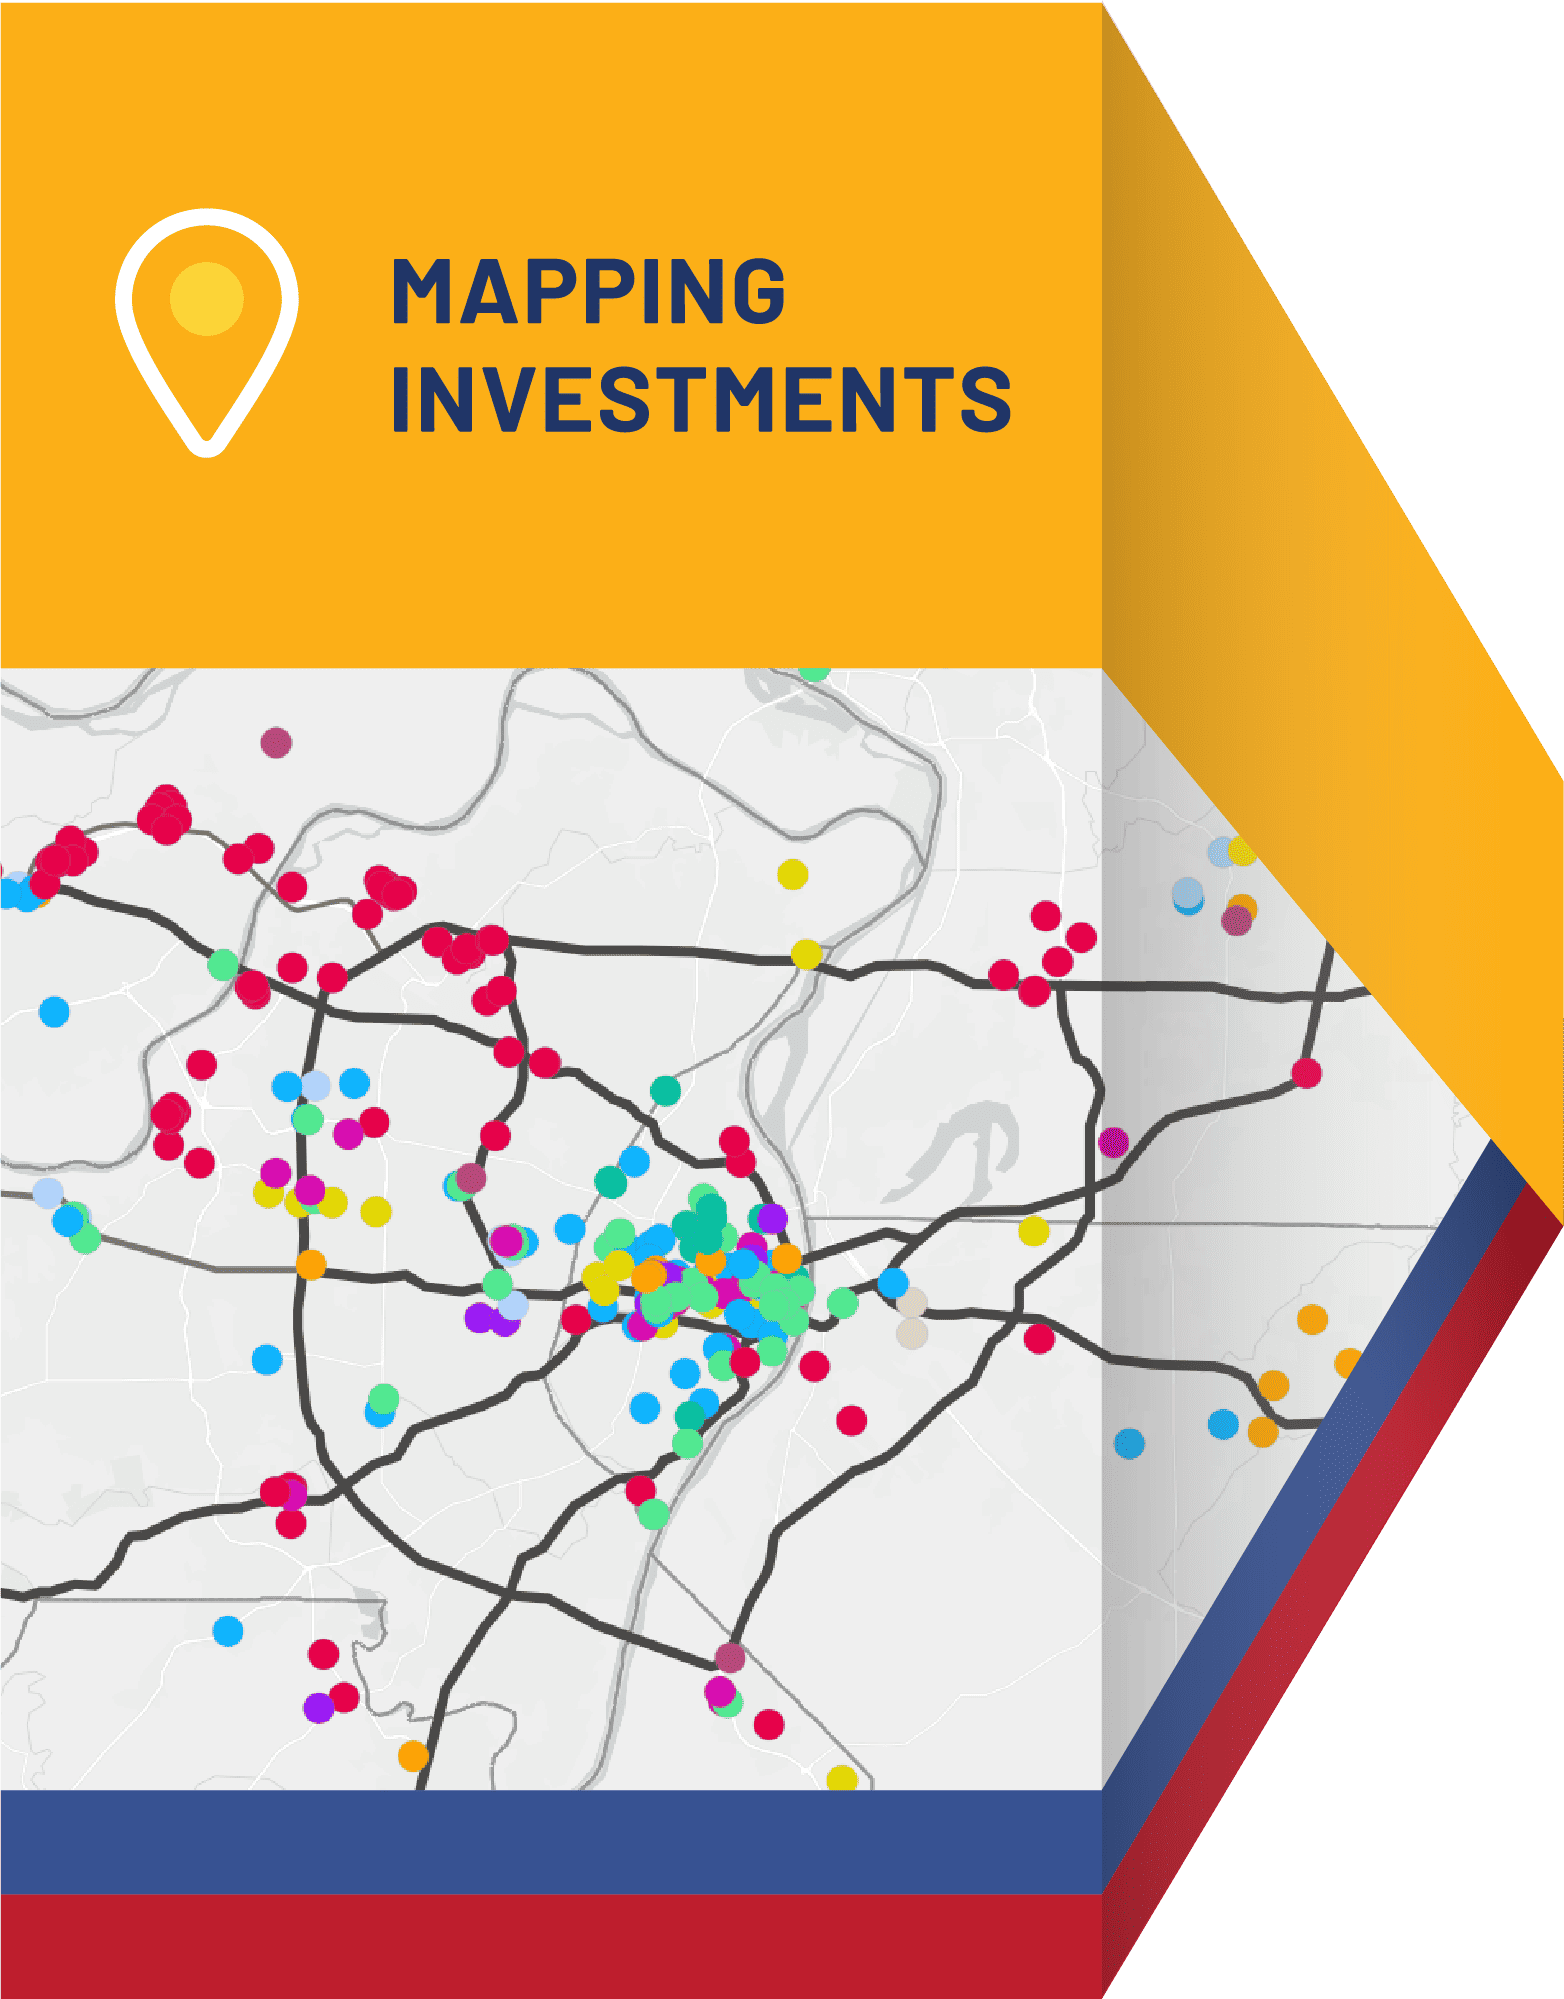
Thinking Spatially
Vision is everything
St. Louis is becoming a global geospatial hub. Through this GIS map, see how our region is coming together to better understand and tell our story of place-based change.
Highlighting Metro Investments and Assets
-
Infrastructure
Depicting ongoing and planned investments bolstering the critical infrastructure and networks upon which St. Louis will thrive for decades to come

What Are We Mapping?
-

Major Developments
Economy-shaping industrial, commercial, multi-family, and institutional developments.
-

Infrastructure Projects
Major investments across transportation, freight and logistics, water, sewer, and energy.
-

Economy-Enabling Assets
Valuable regional features and institutions that enable economic growth.
-

Contextual Data for Inclusive Growth
Data related to North Star Metrics that help illustrate aspects of racial and spatial equity.
Mapping Investments
View the GIS map to see more information on major capital projects and assets throughout the region and by county. This map will be updated on an ongoing basis.
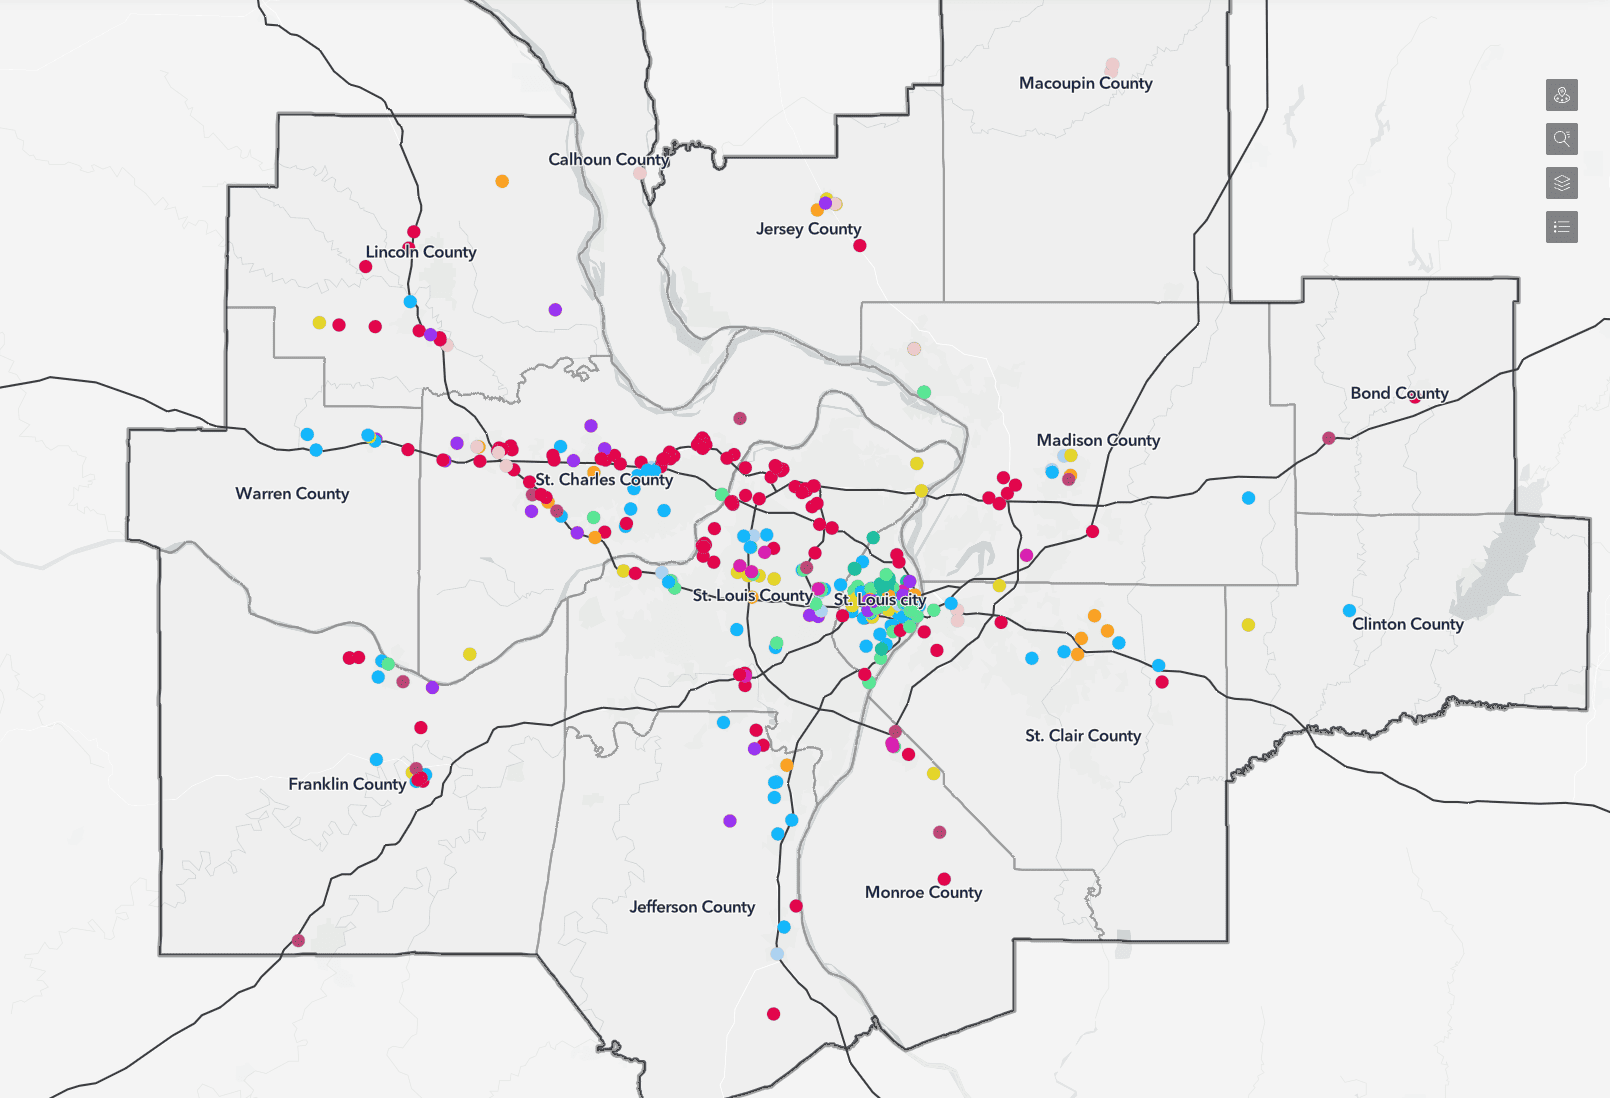
Use a desktop device to access a full collection of data.
Email Link for Later