Following the North Star
Data and Targets for Inclusive Growth


Following the North Star
Data and Targets for Inclusive Growth
Informing regional leaders and providing visibility to the public on St. Louis’ progress towards inclusive economic growth and competitiveness.
Learn more about the metrics, methodology, and data sources.
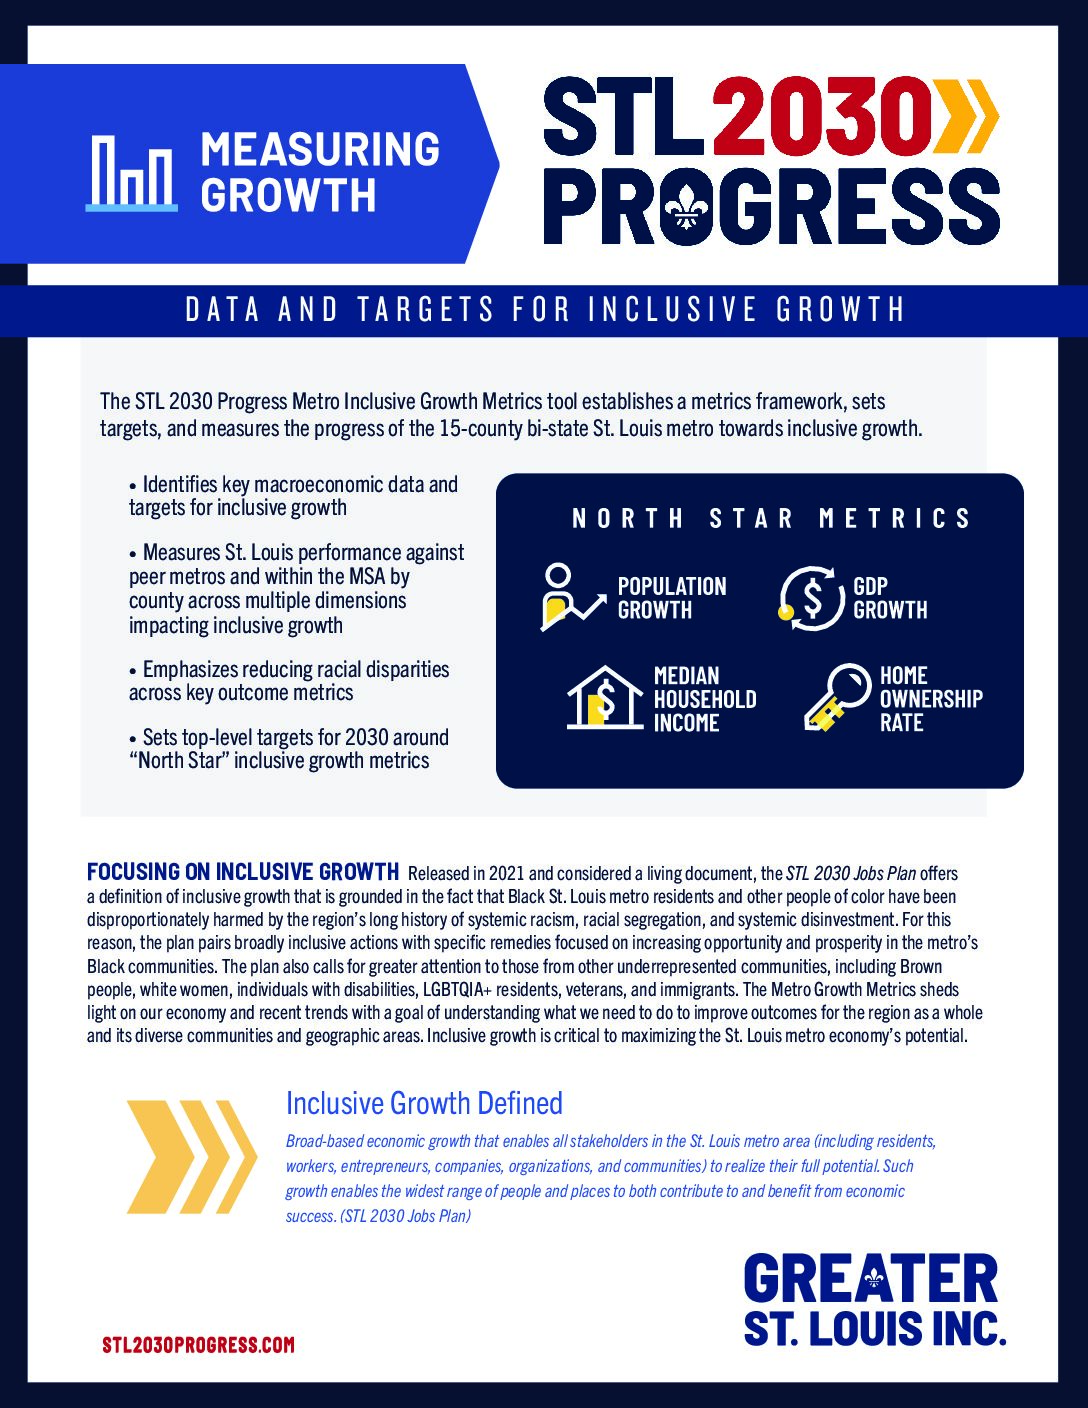
How we measure inclusive growth
Our metrics framework consists of four North Star measures along with aspirational targets to close the gap with better performing peer regions by 2030. We measure progression by tracking outcomes in four Focus Areas.


Addressing Racial Disparity in Our Region
We must face the deep structural challenges to inclusive growth. Where possible, all metrics will be disaggregated by key inclusivity lenses. Targets for median household income and home ownership will focus on closing our metro’s Black-to-white racial parity gap, striving toward gap elimination.


Benchmarking Performance Against Peer Markets
We selected peer metros based on comparable population, economic profile, and/or geography. St. Louis competes against many of these metros for business and talent.
Measuring Growth
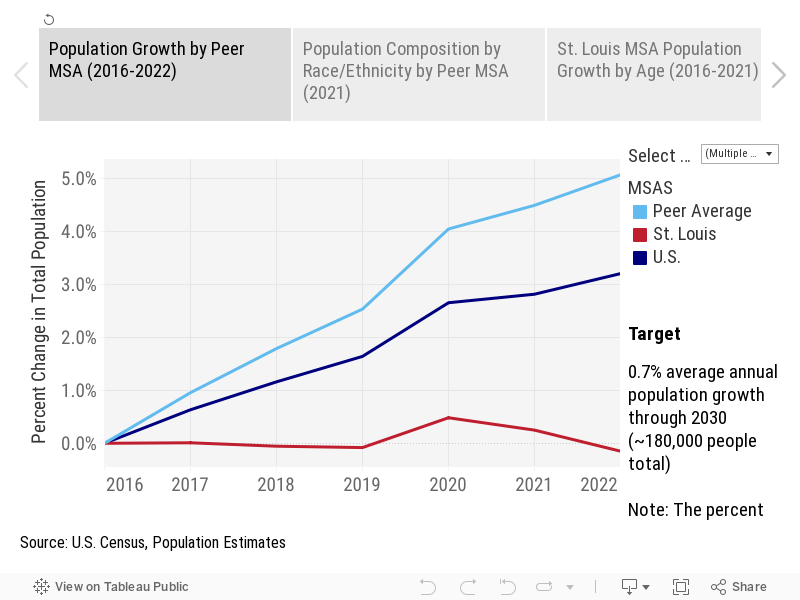
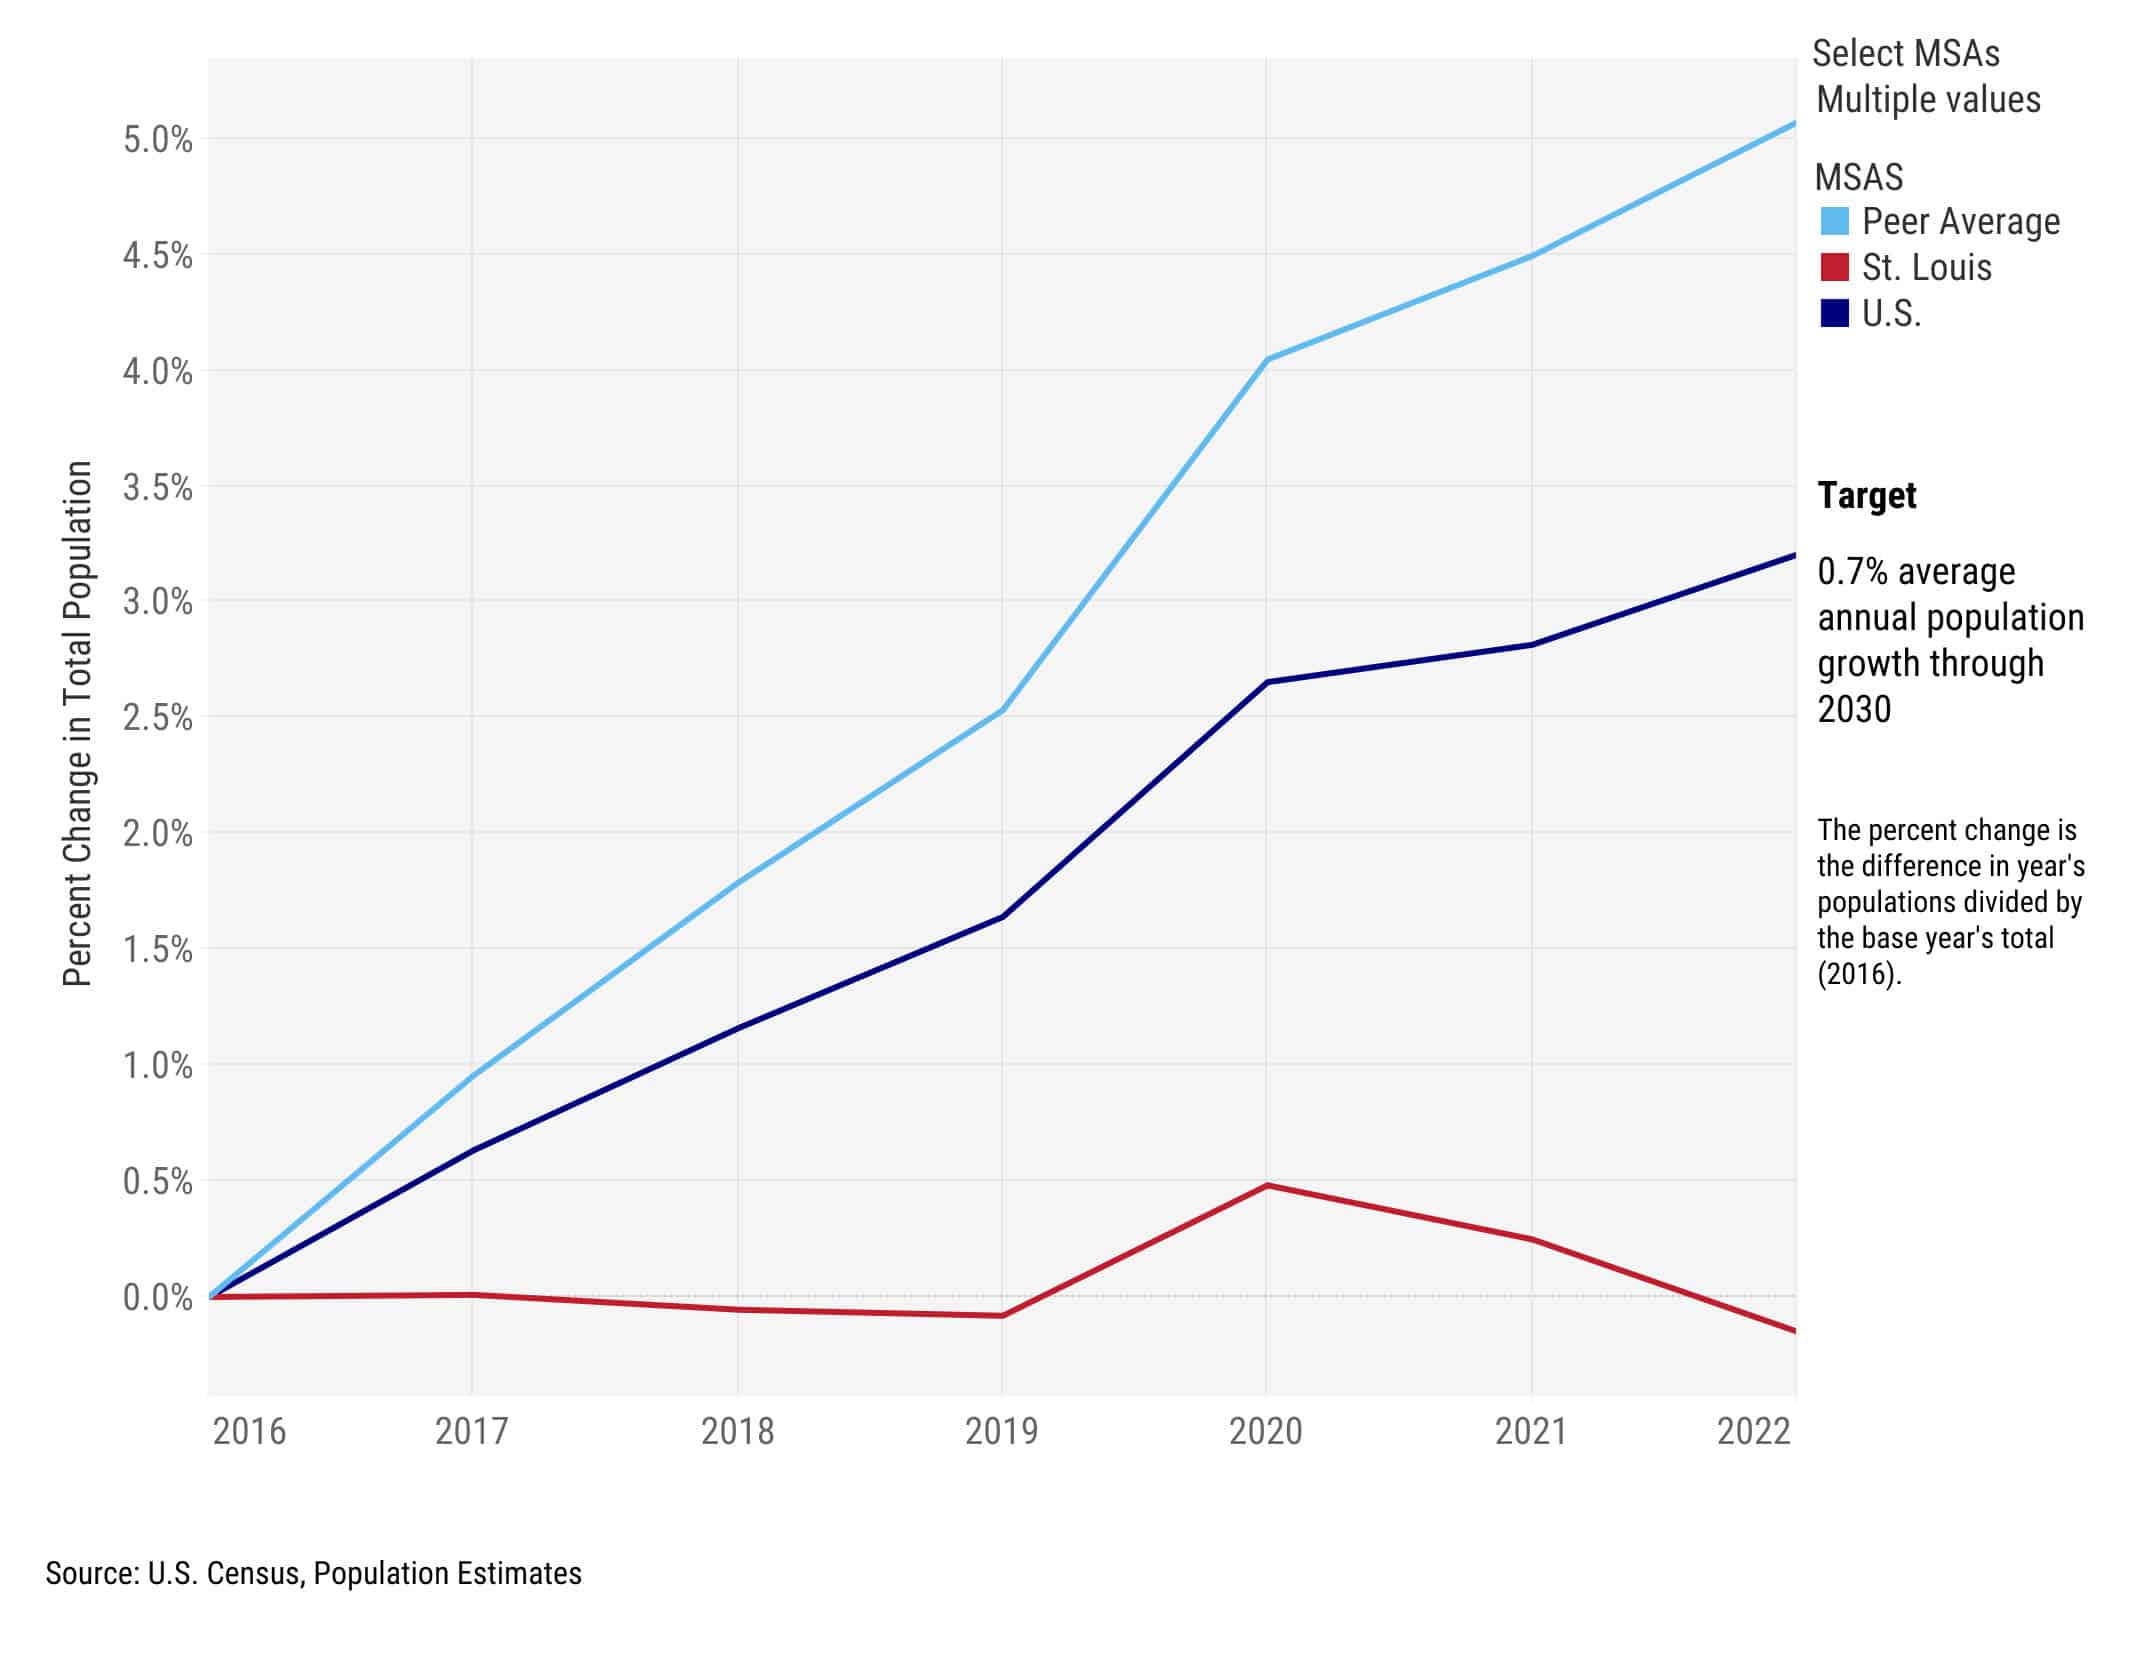
Steady population growth drives a thriving regional economy. People are a critical regional asset and racial equity and inclusion strengthens communities. A growing, diverse, and dynamic workforce is key to economic success.
Use a desktop device to access a full collection of data.
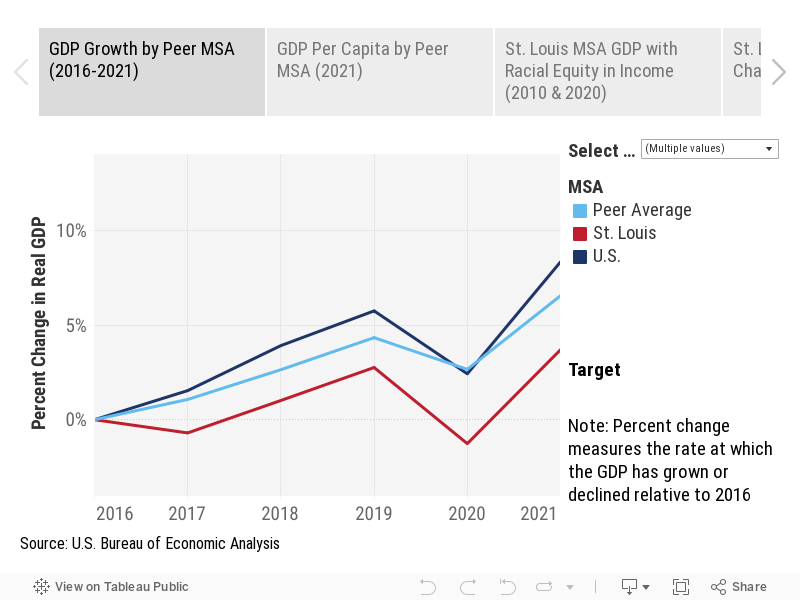
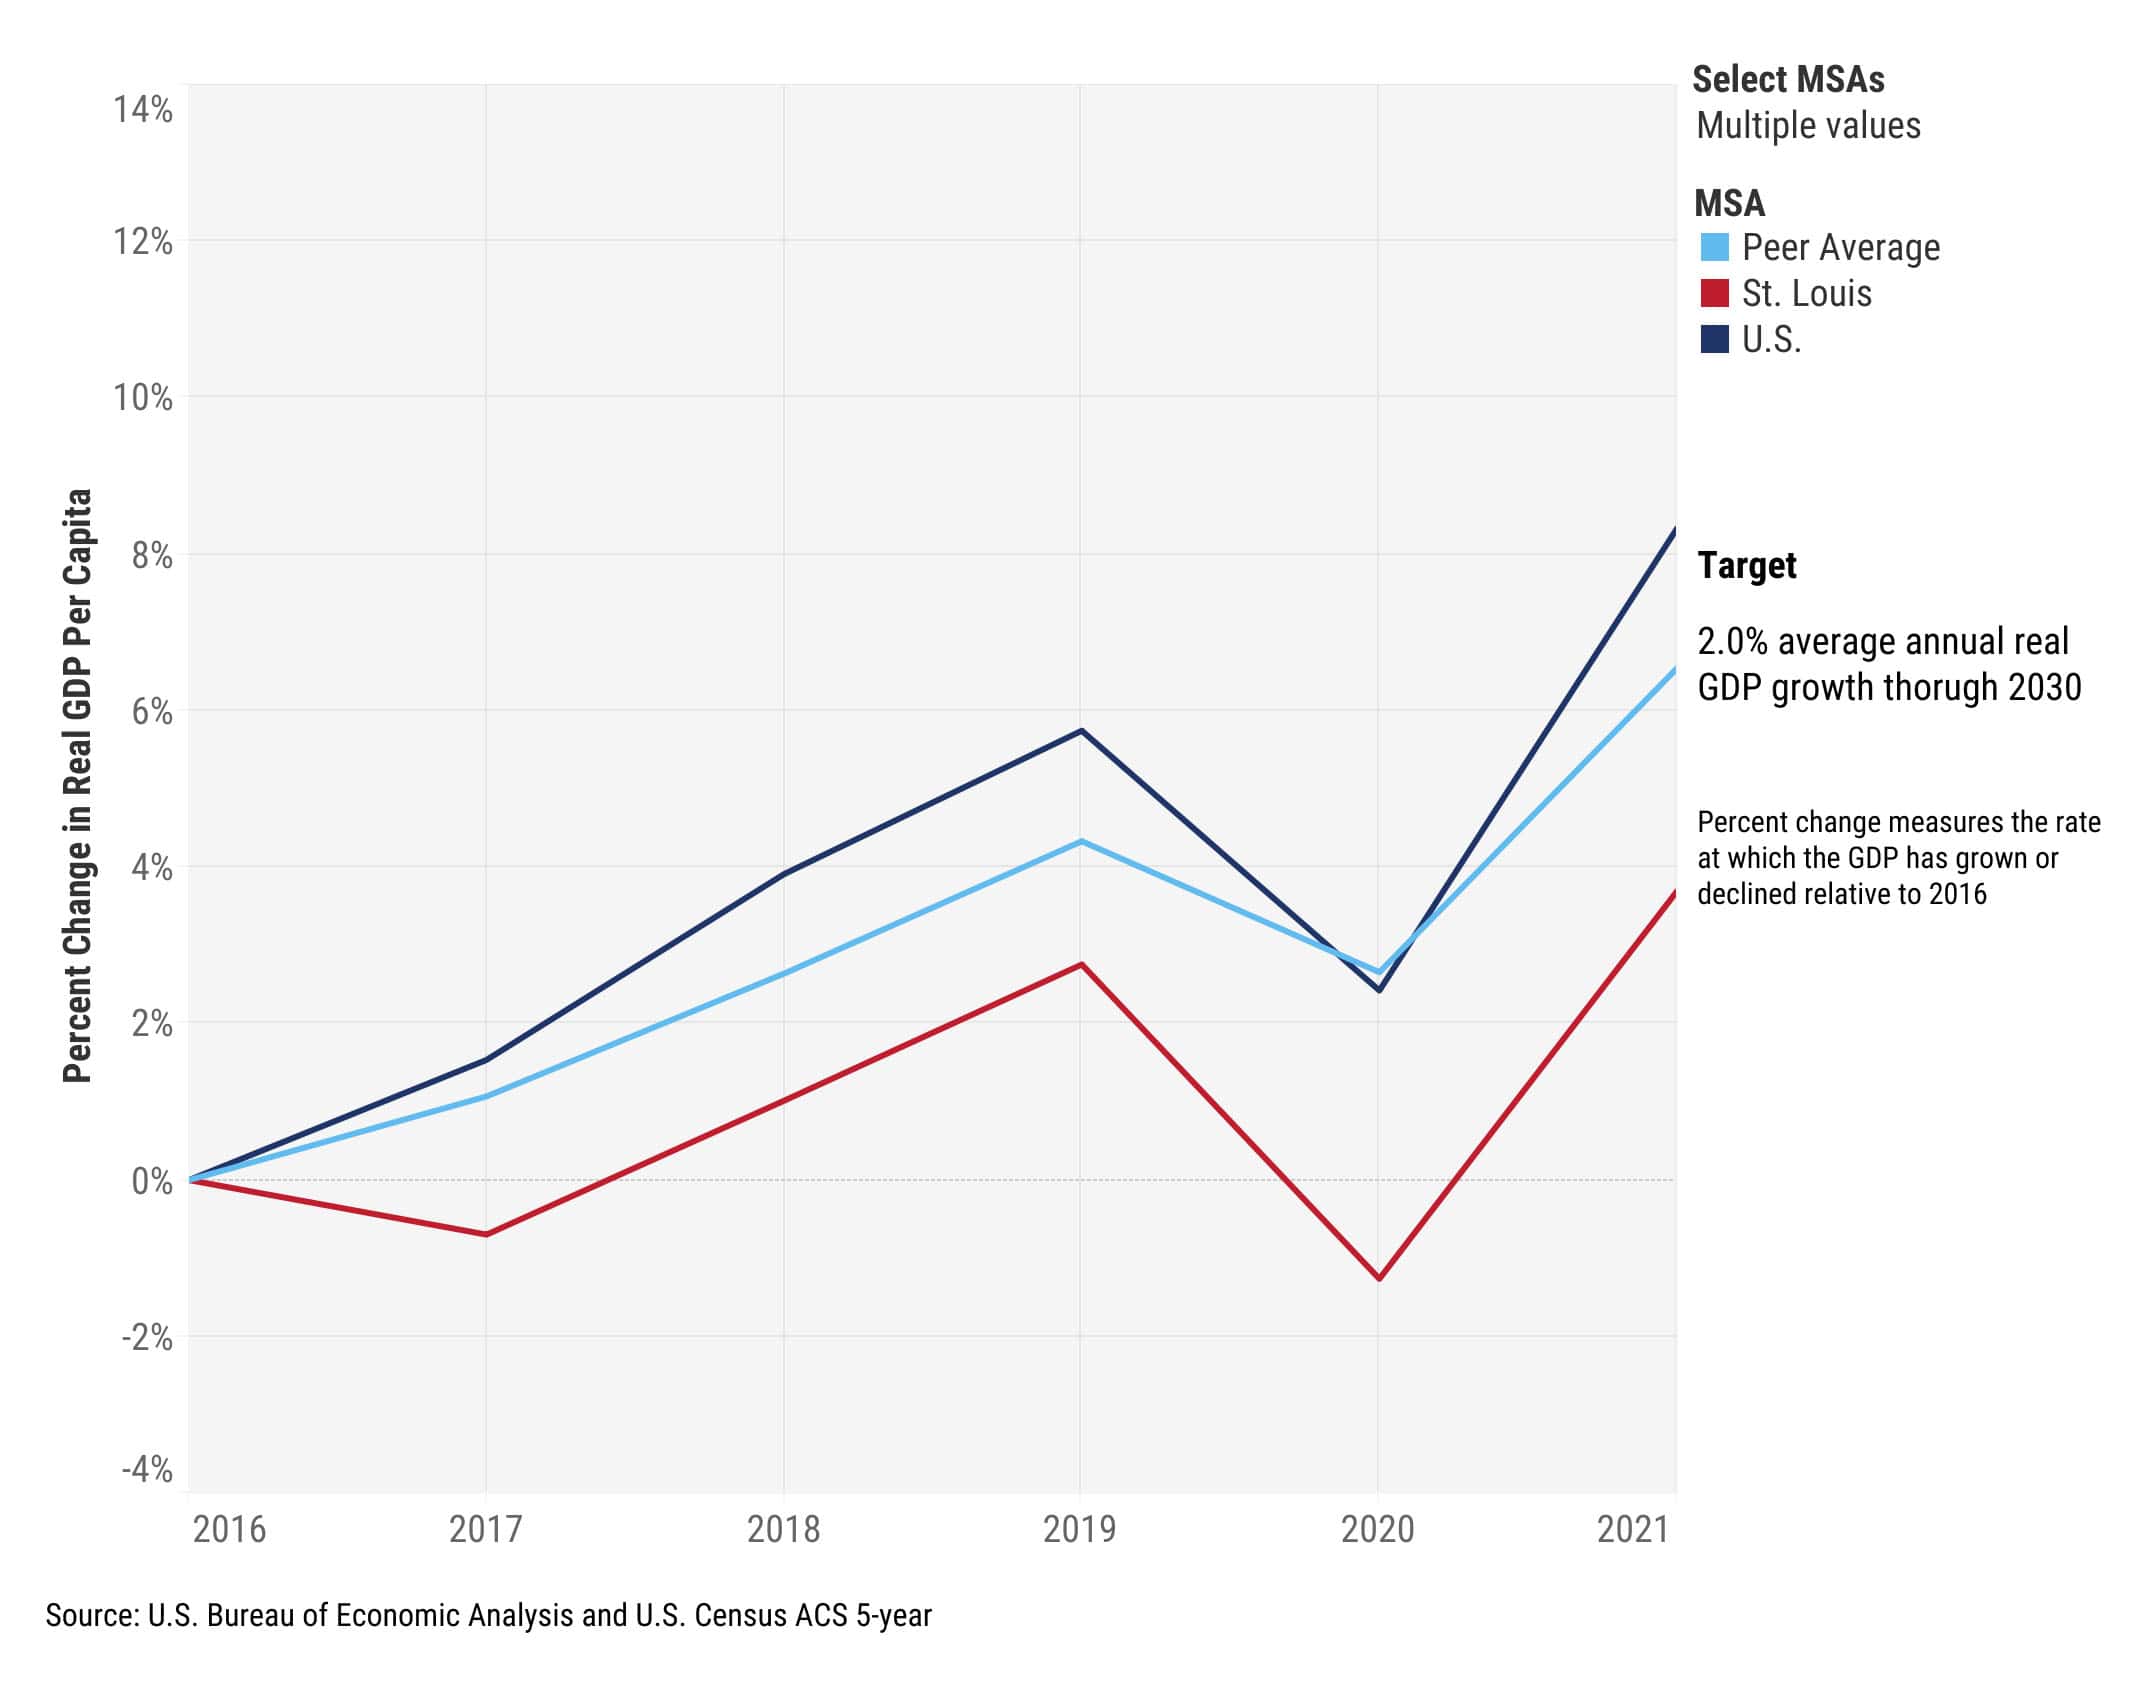
Email Link for LaterGross domestic product, the broadest measure of a regional economy, estimates the total value of the goods and services produced in a metropolitan area. Real GDP growth is an inflation adjusted measure of a growing economy.
Use a desktop device to access a full collection of data.
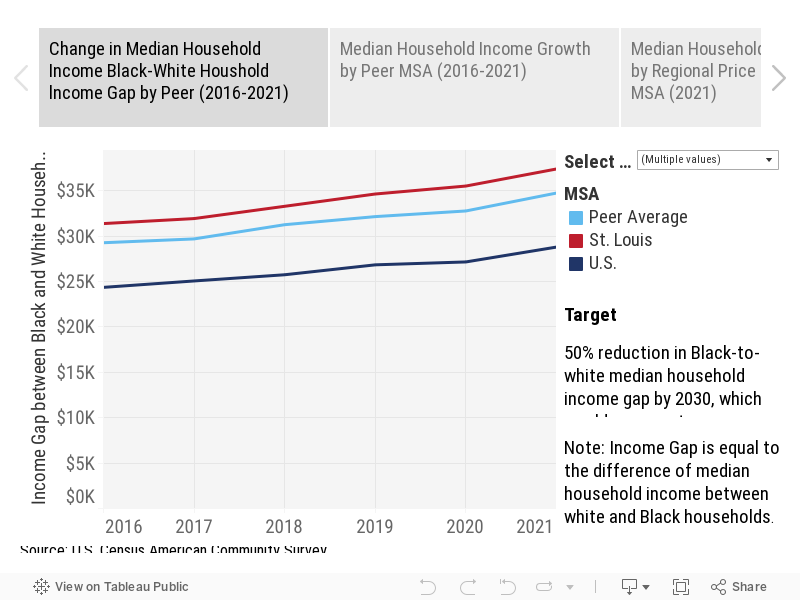
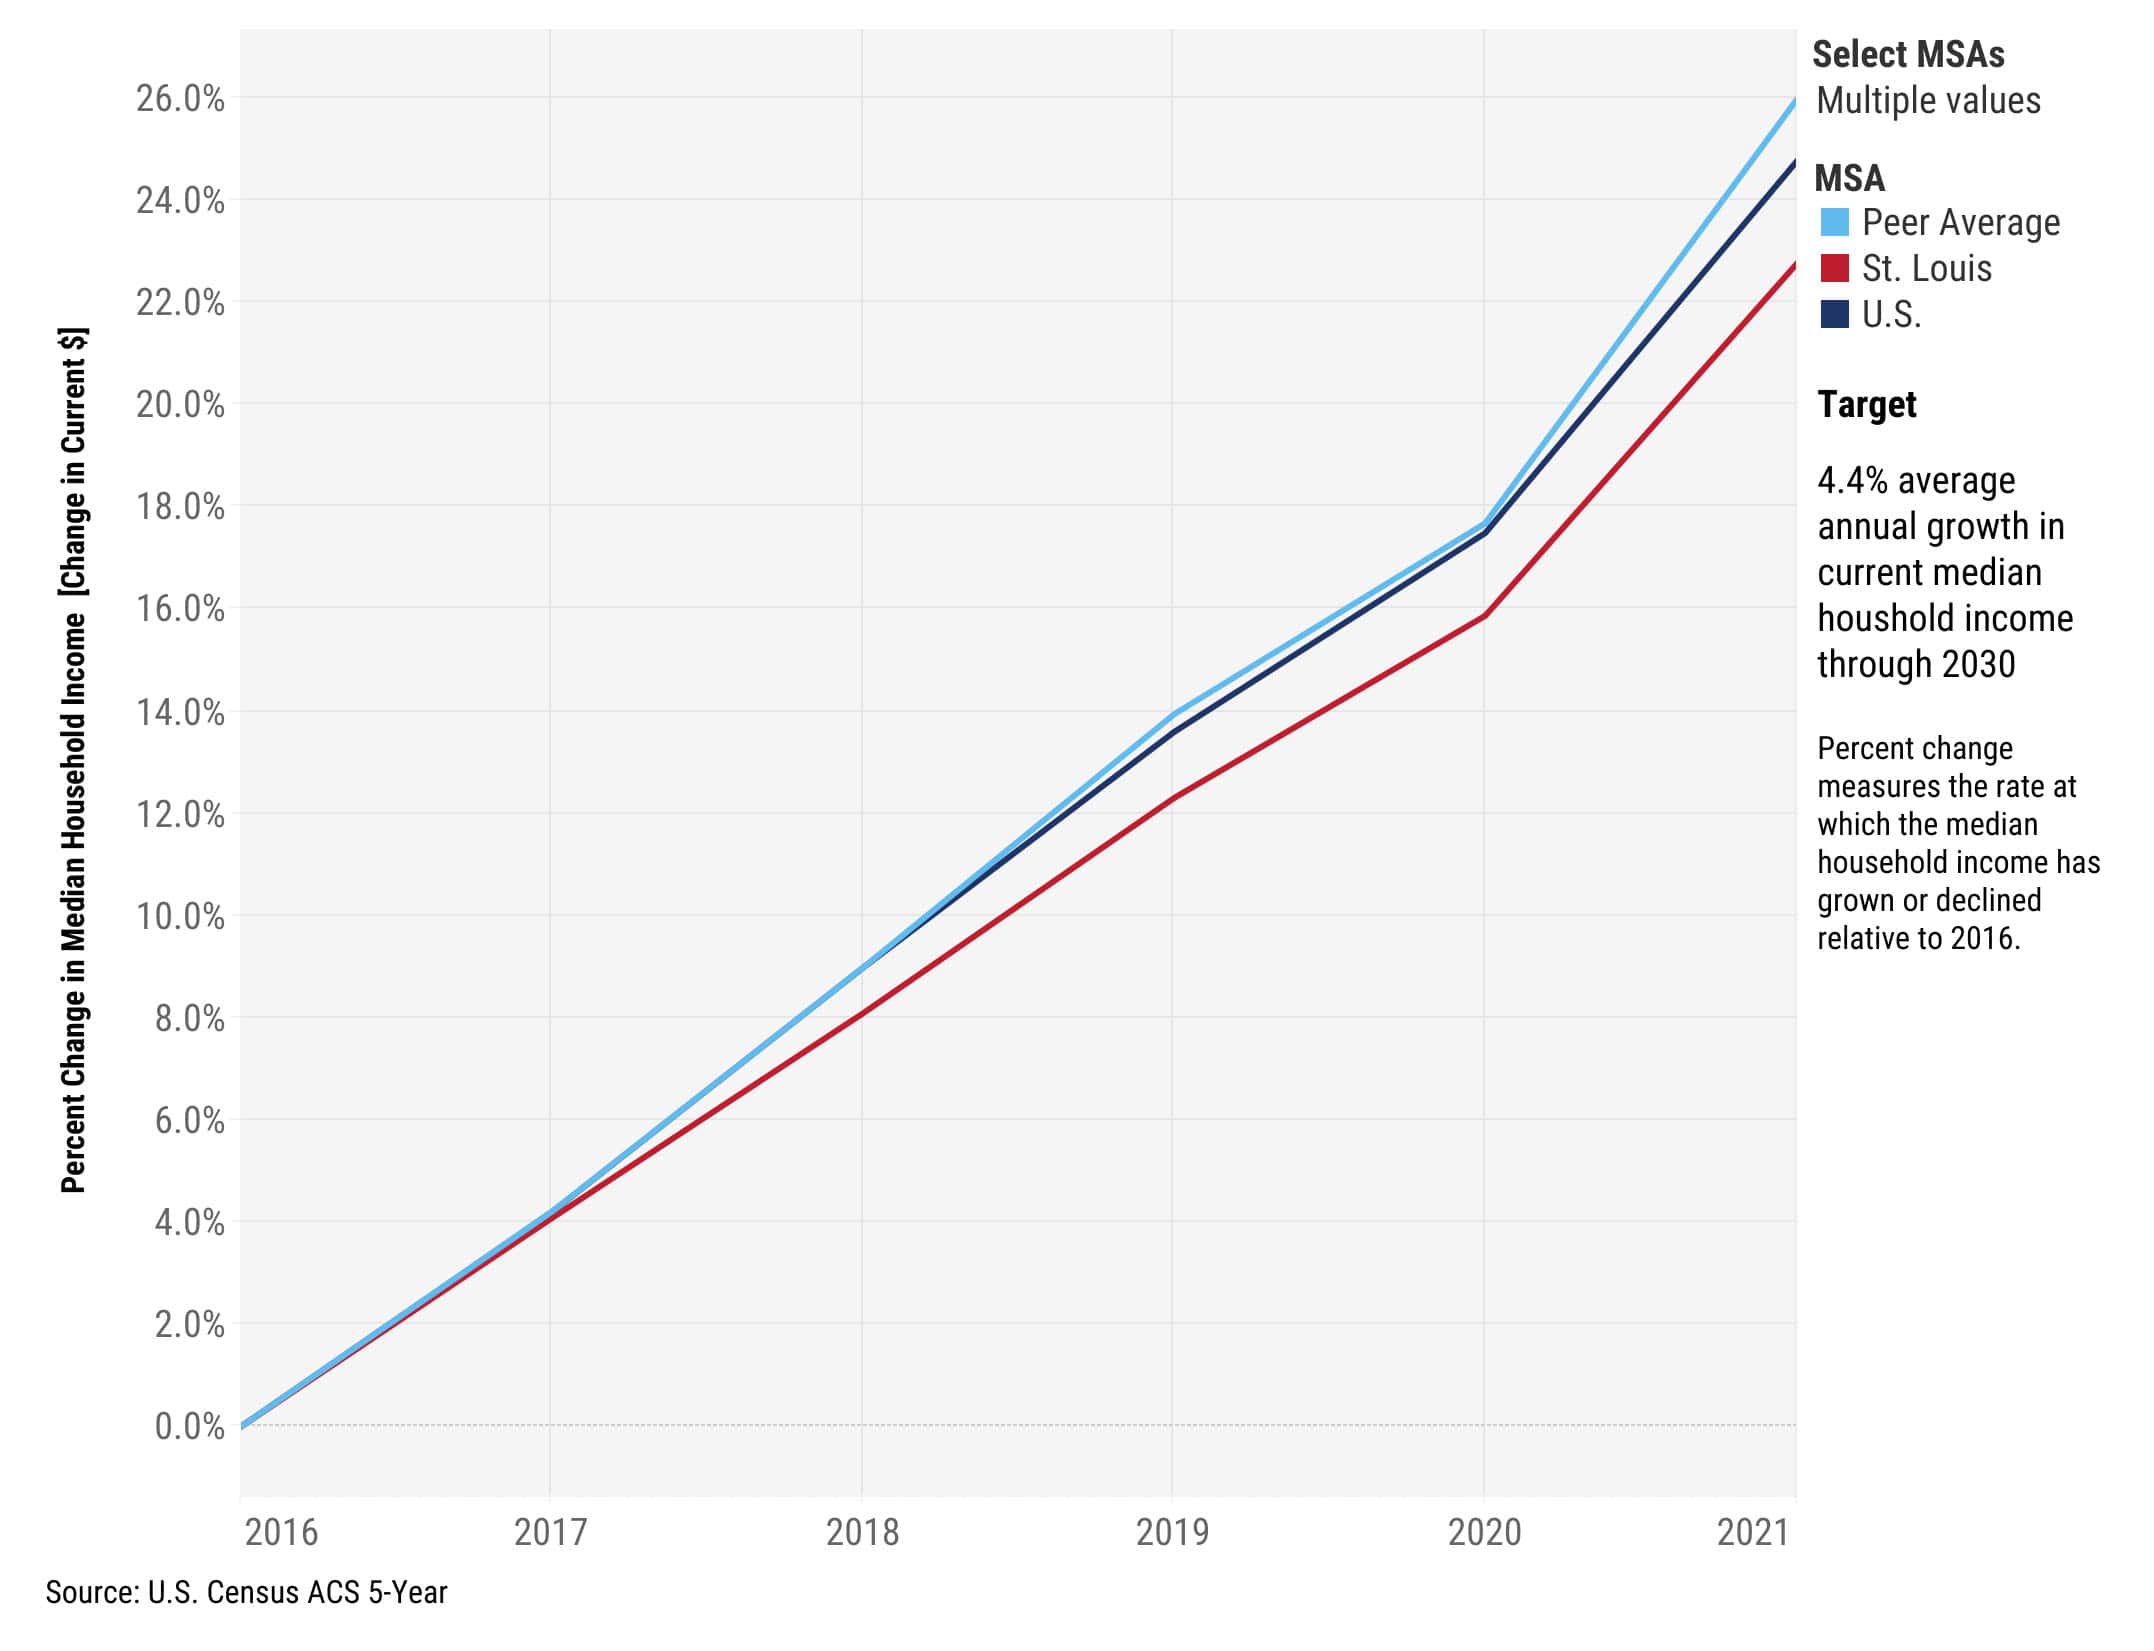
Email Link for LaterThis income metric can provide insight into a region’s economic equality. Shrinking the racial gap in household income would strengthen families and the economy by bolstering consumer spending and driving an increase in GDP.
Use a desktop device to access a full collection of data.
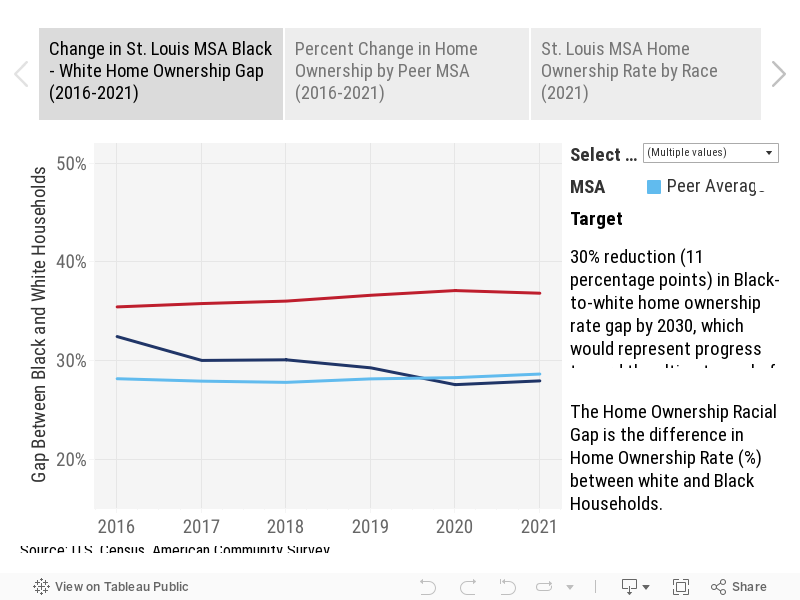
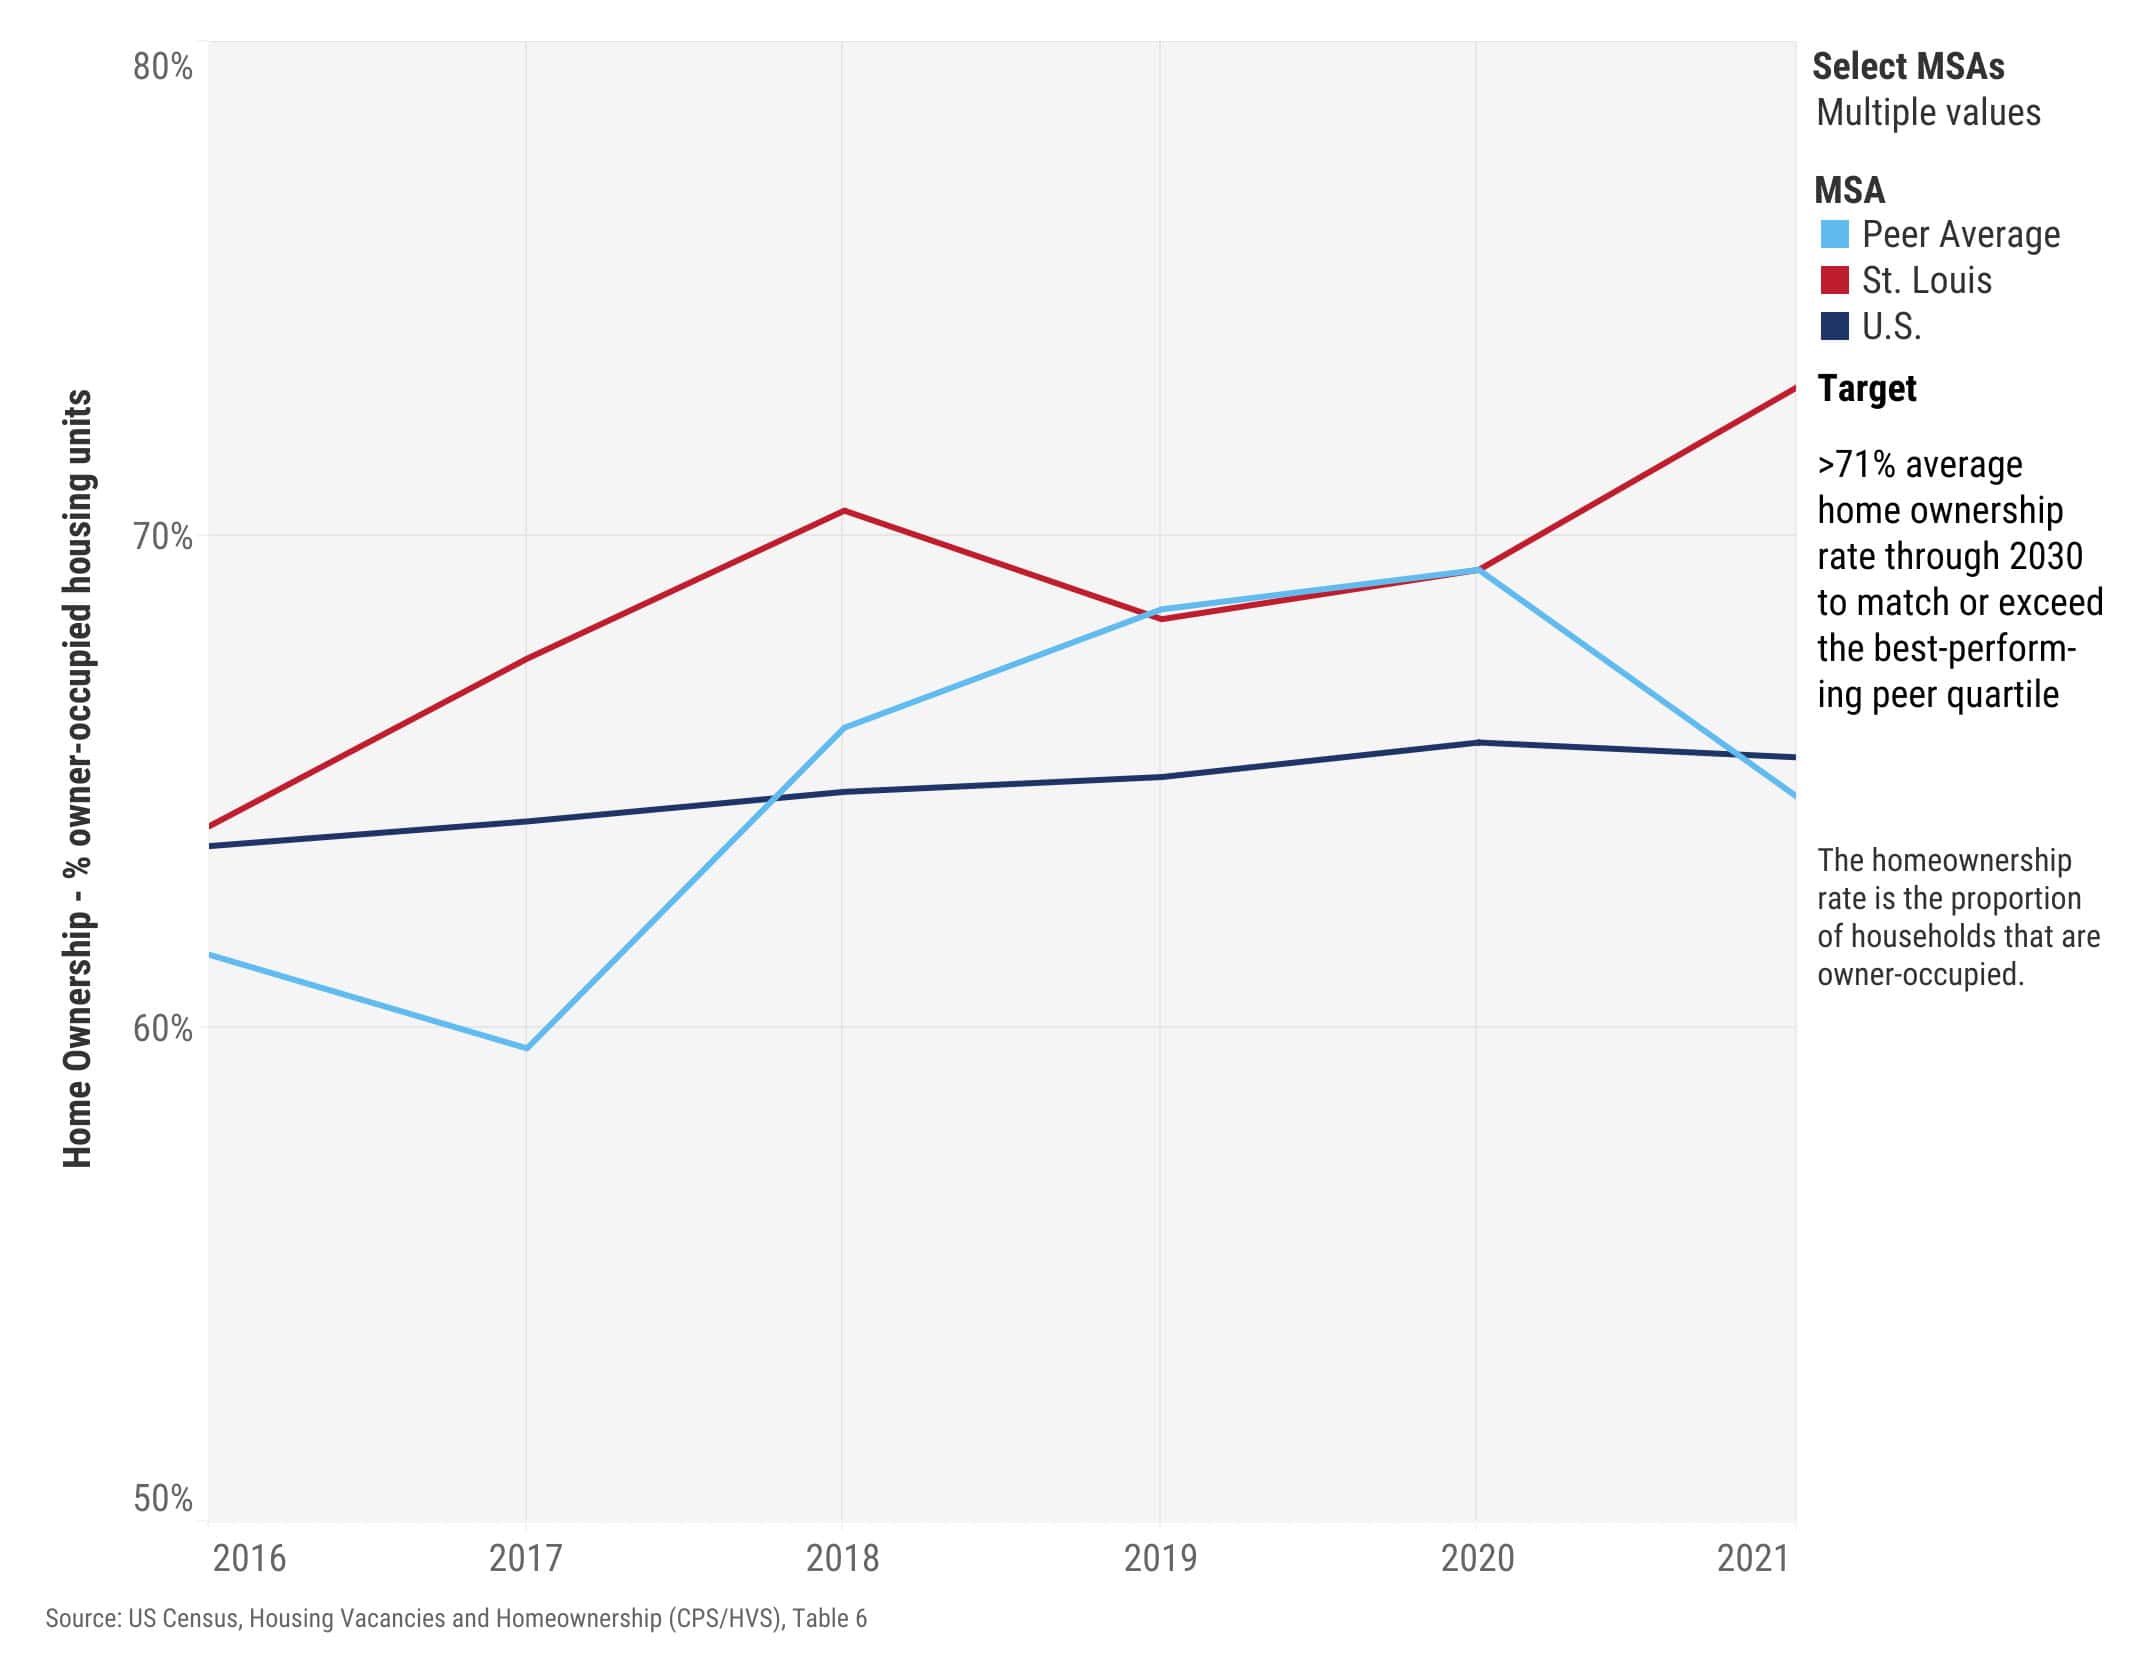
Email Link for LaterHome ownership is a widely available and effective way to build household wealth and prosperity. Closing the racial home ownership gap allows more St. Louisans to build equity to pay for education or start a business.
Use a desktop device to access a full collection of data.
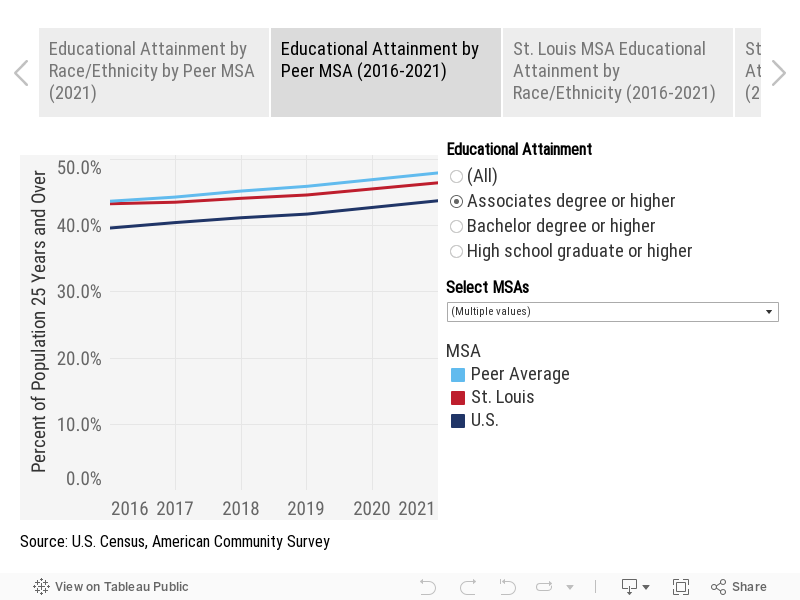
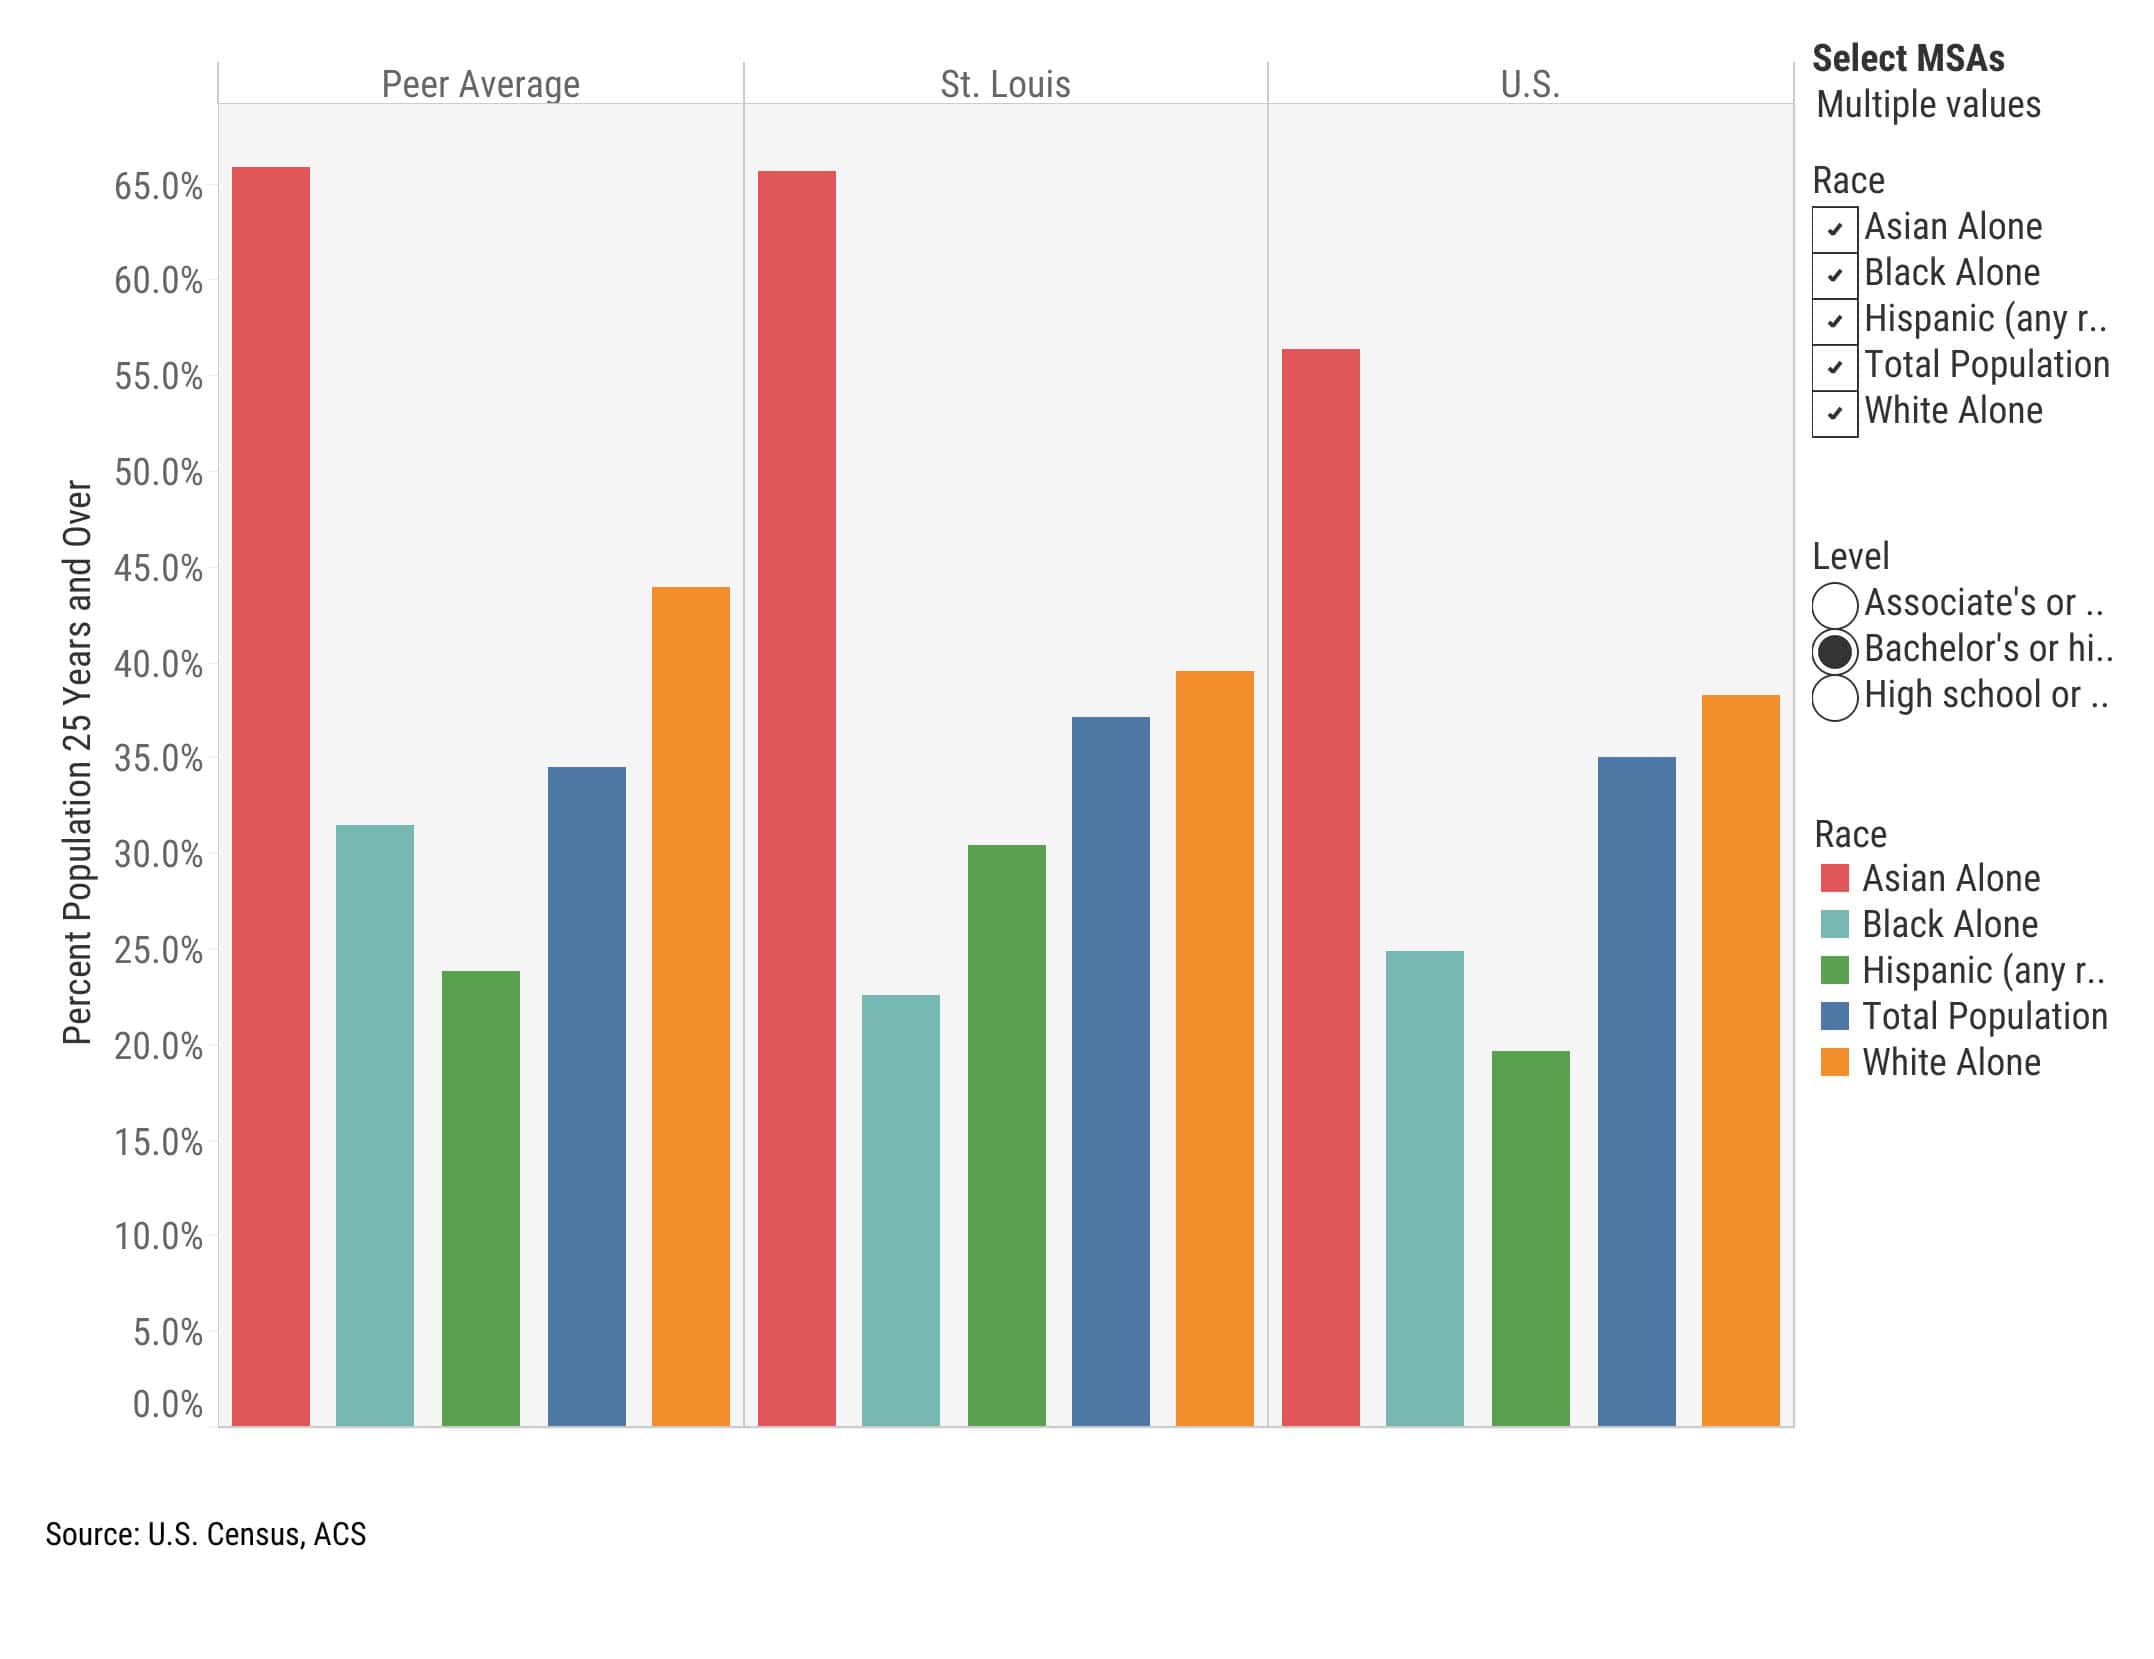
Email Link for LaterAn educated workforce supports local business growth and is key to global competetiveness. Educational attainment is correlated with earning potential, while equity is critical to building a strong workforce.
Use a desktop device to access a full collection of data.
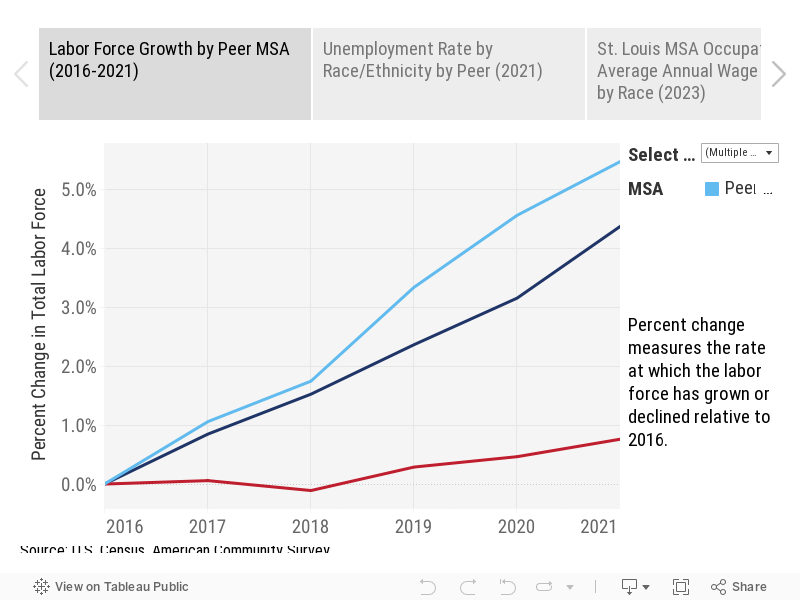
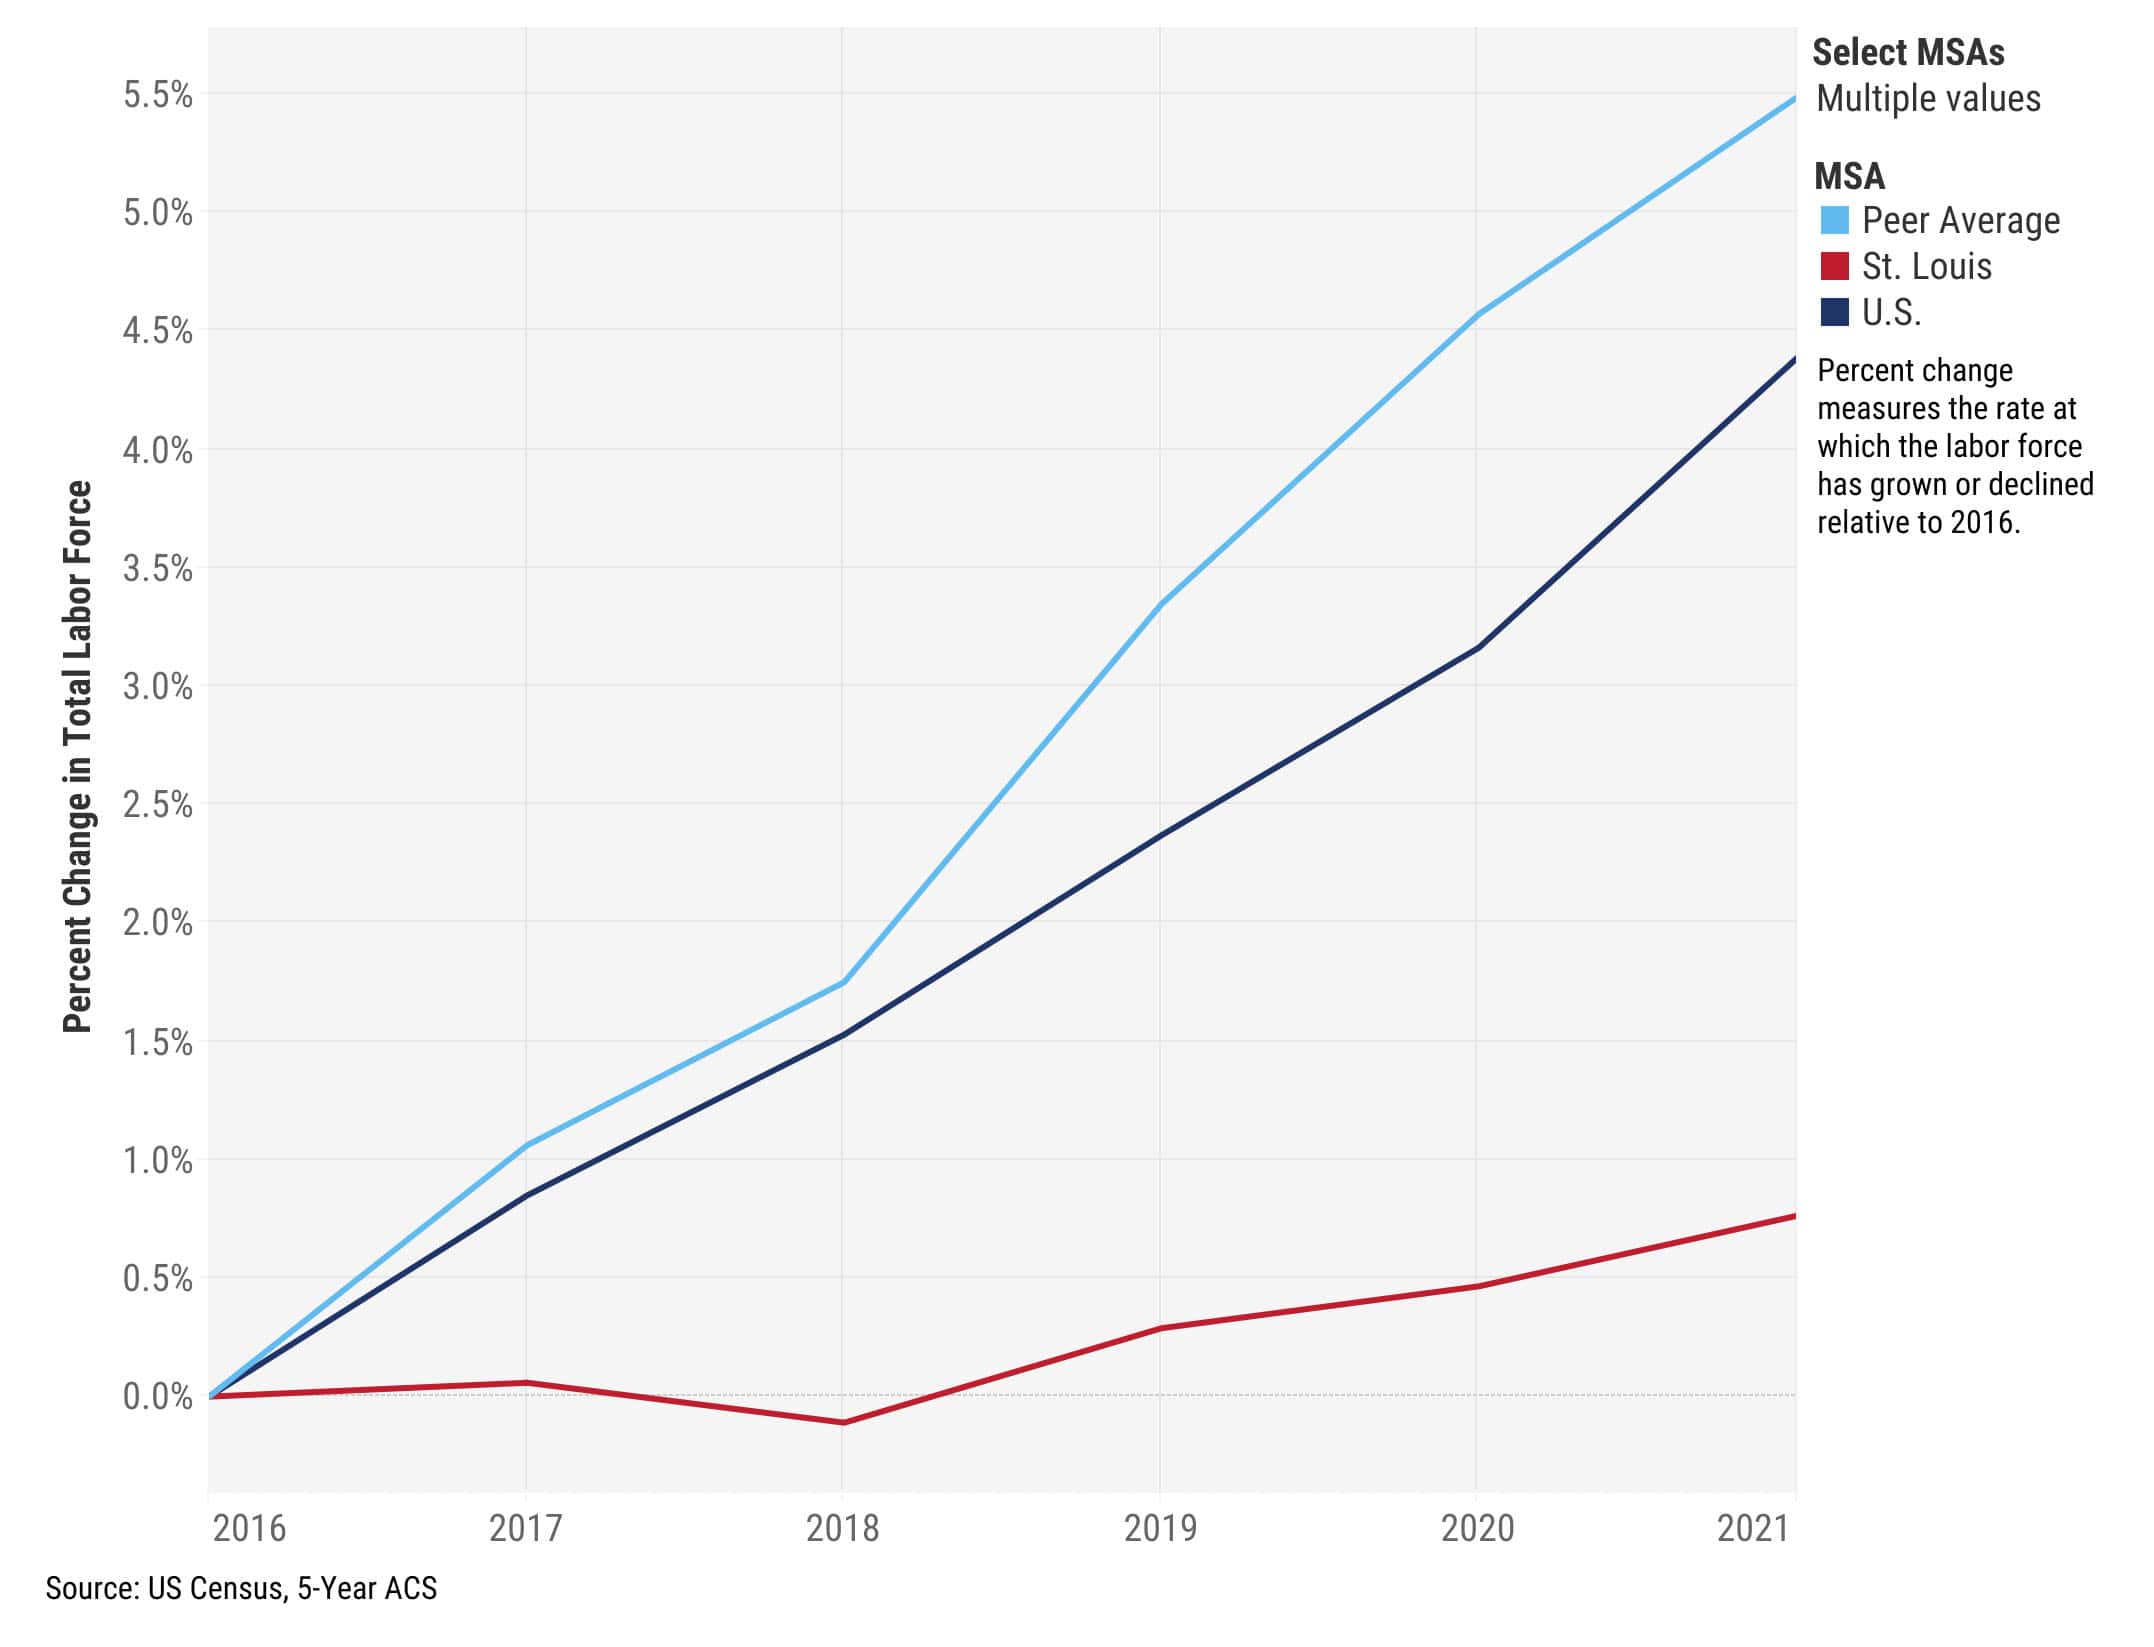
Email Link for LaterBusinesses make expansion and location decisions based on access to talent. Good employment opportunities can draw and retain people in the region. An inclusive labor force strengthens households, communities, and businesses.
Use a desktop device to access a full collection of data.
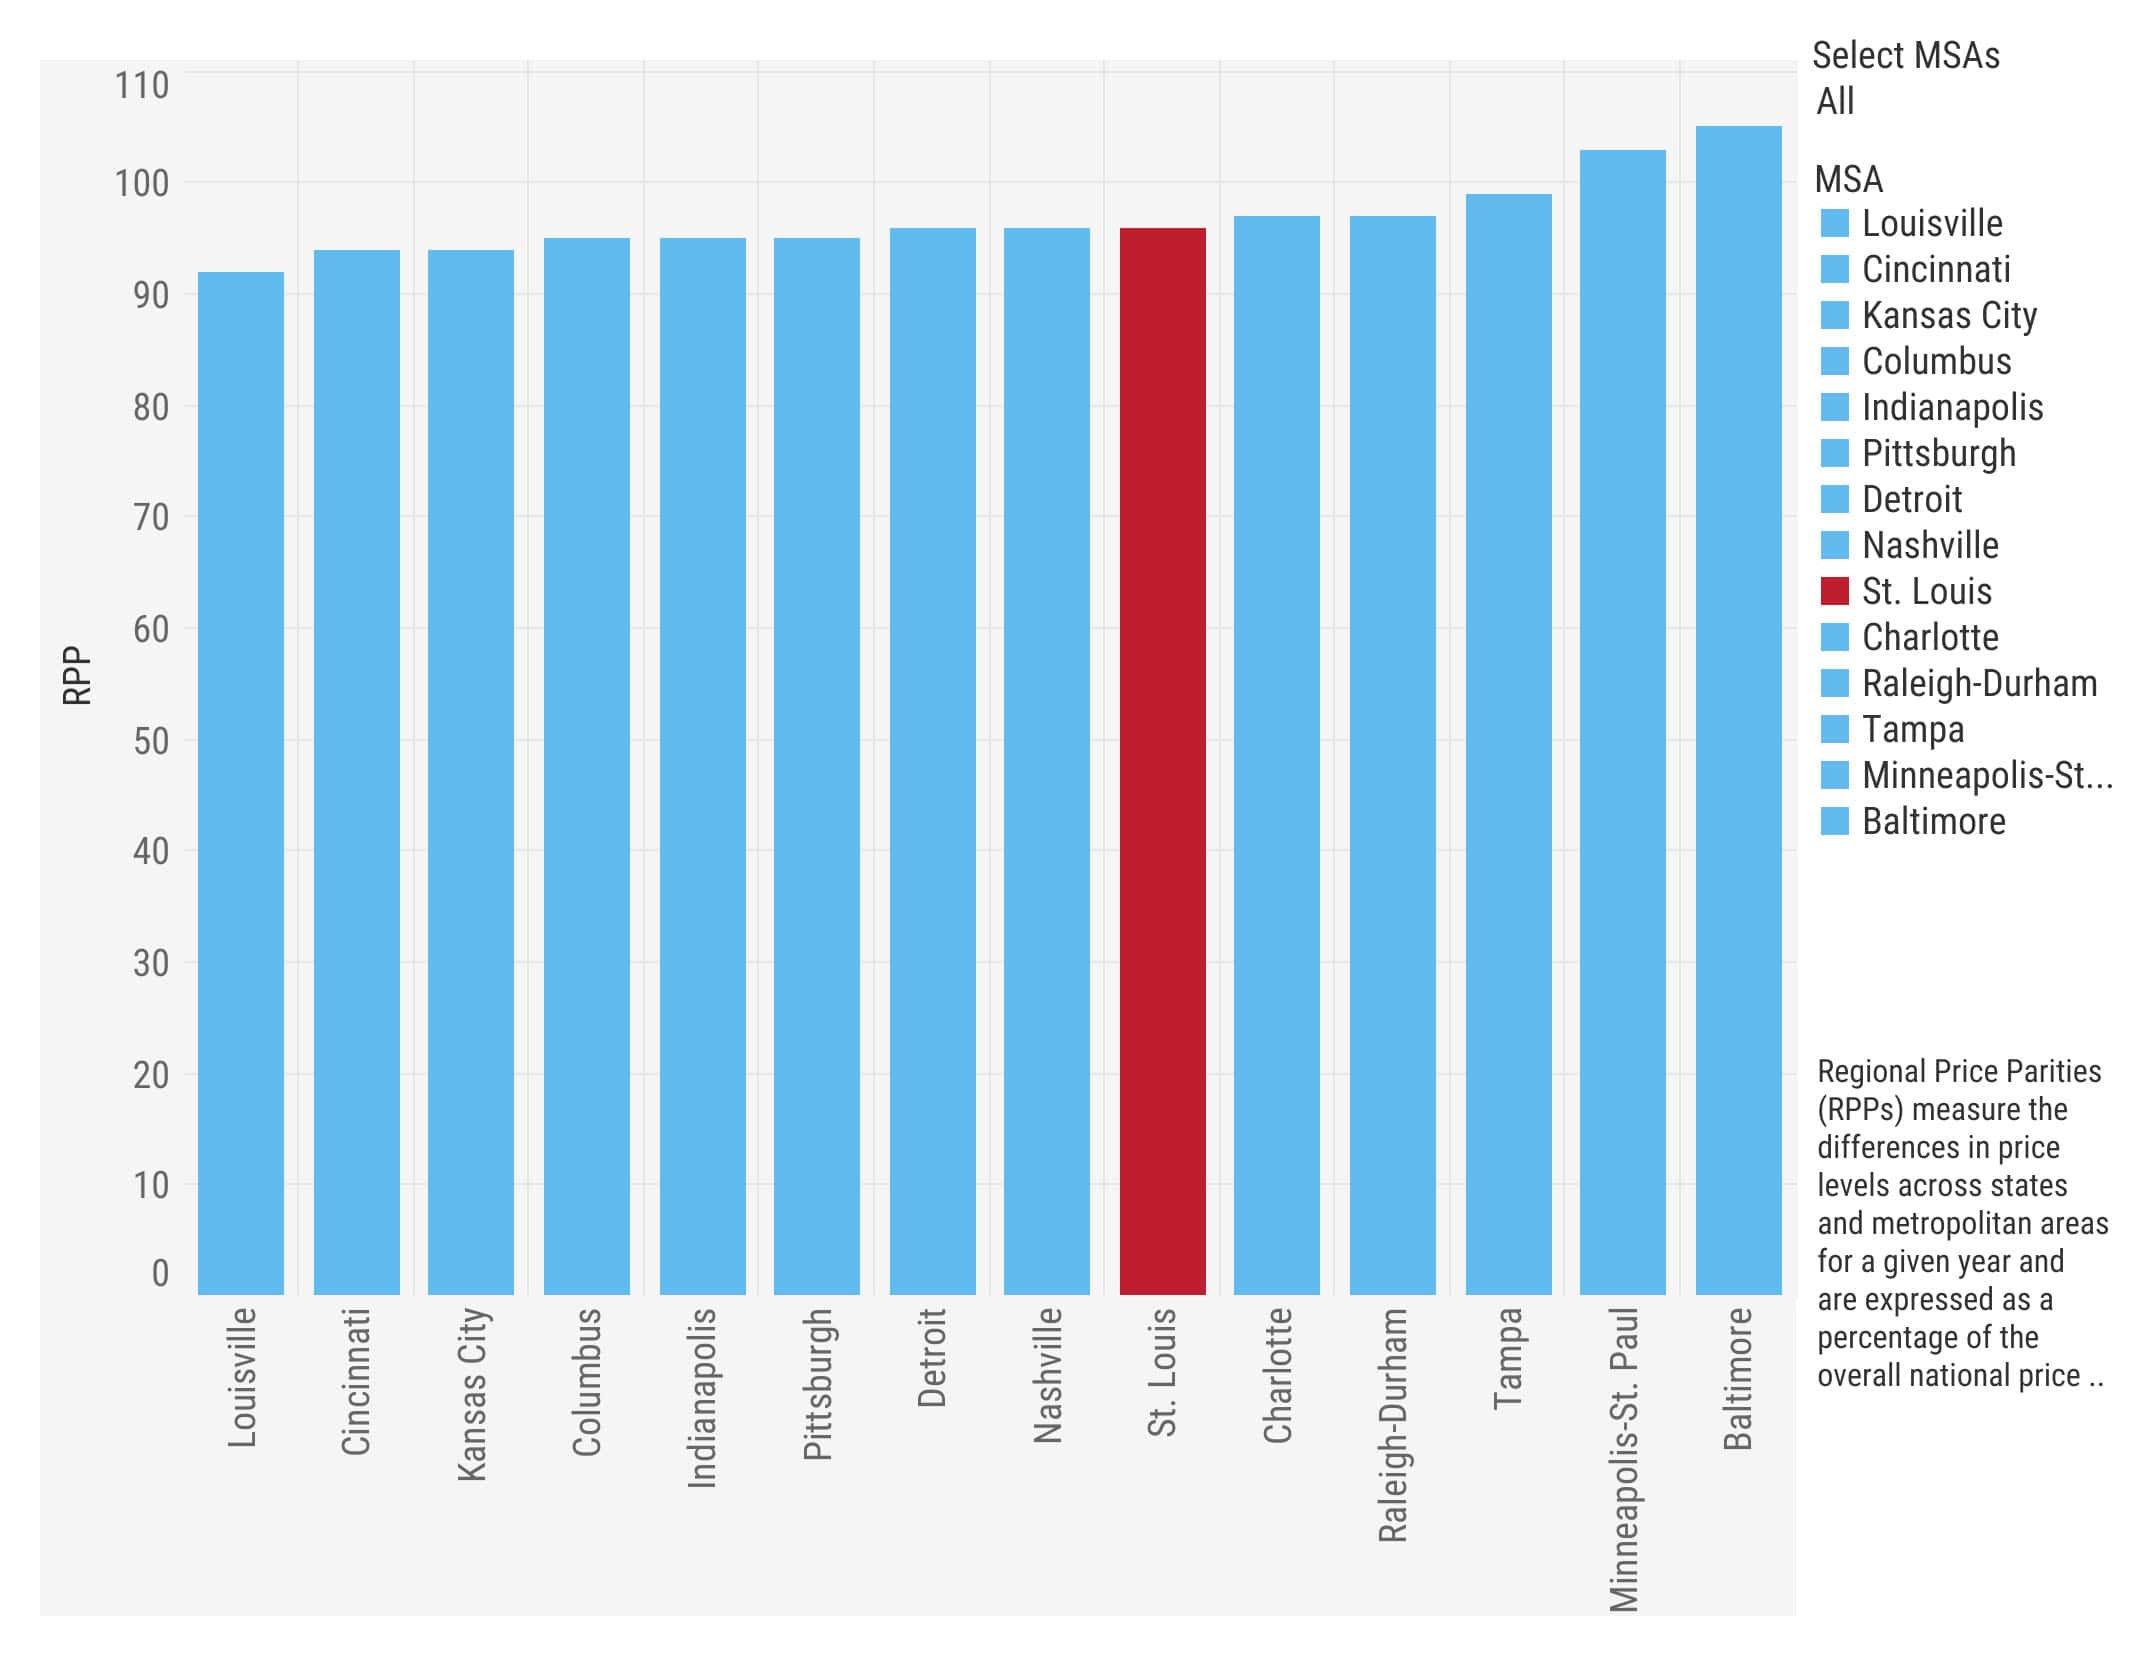
Email Link for LaterA region’s cost of living has a broad impact on quality of neighborhoods, housing, and economic opportunities. Our competitive cost-of-living is attractive to businesses looking to relocate or expand in St. Louis.

Use a desktop device to access a full collection of data.
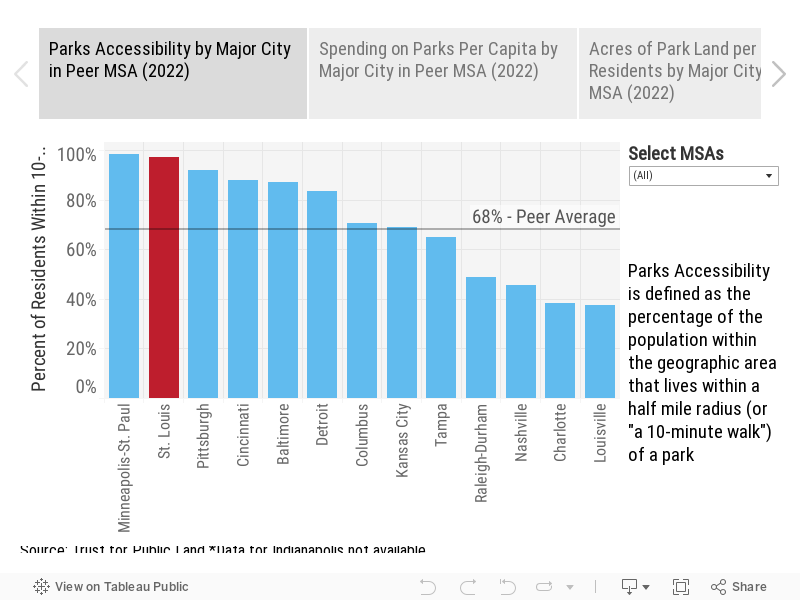
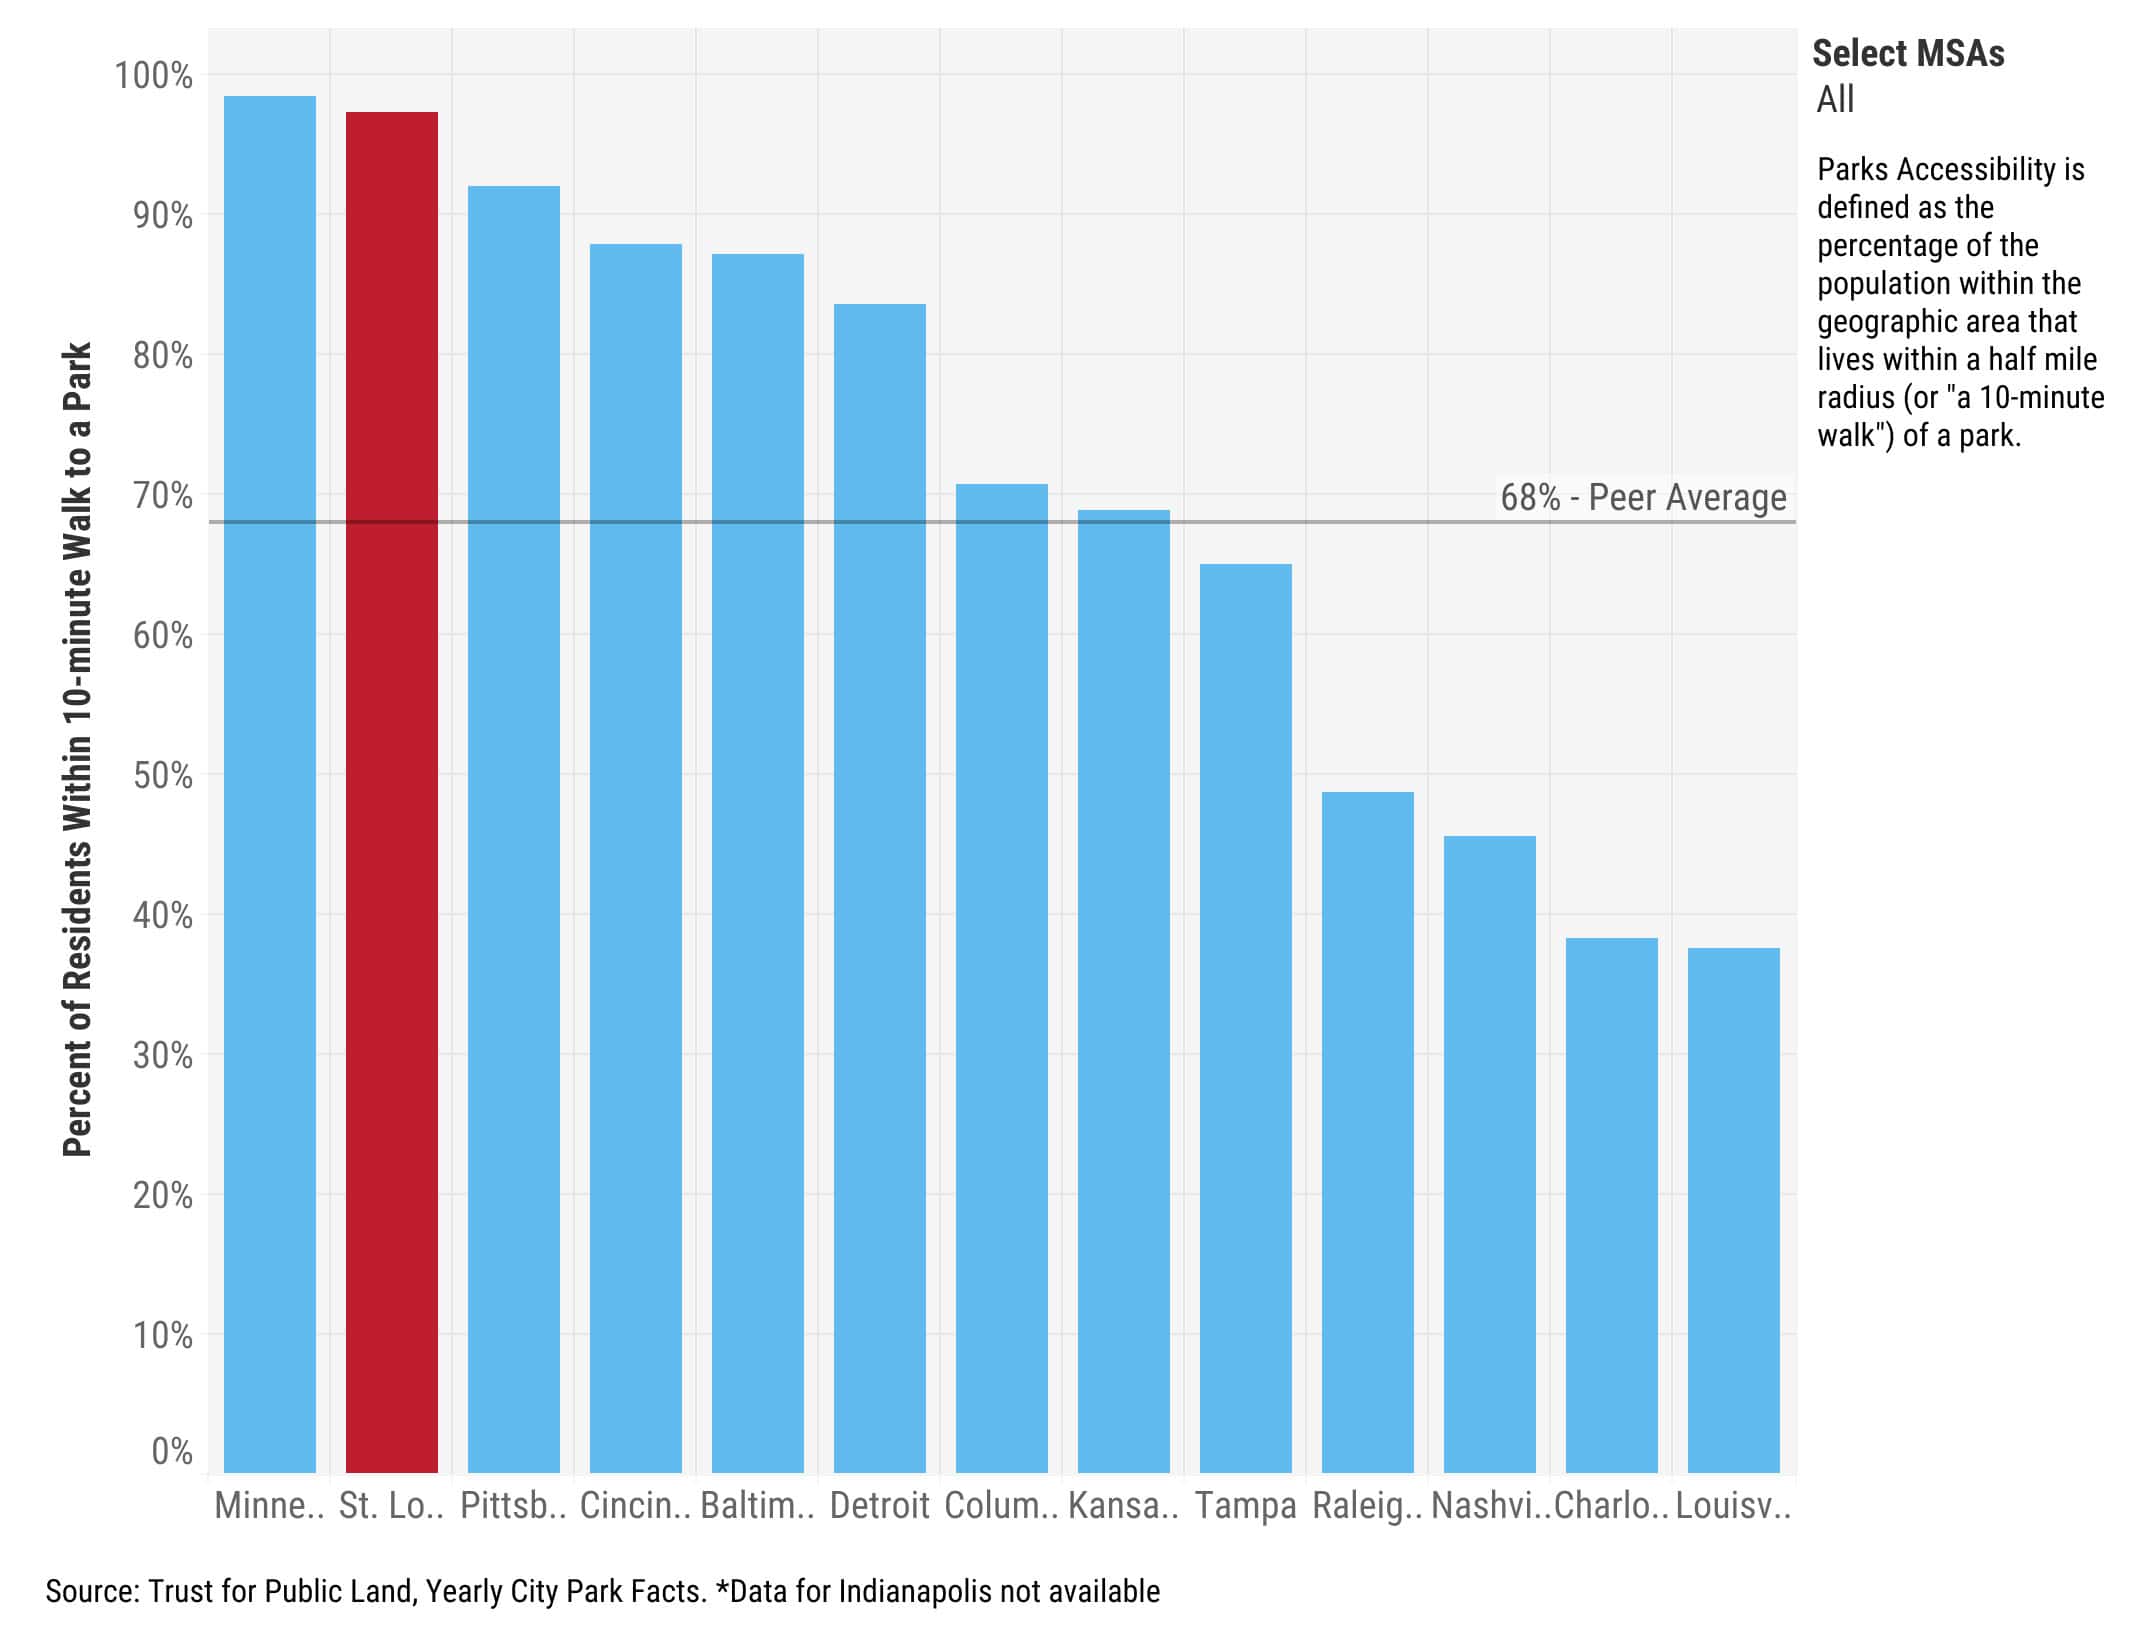
Email Link for LaterTalent is attracted to great places to live. The quality of community reflects the degree to which a community is thriving based on investment in and abundance of arts, culture, greenspace, and neighborhood amenities.
Use a desktop device to access a full collection of data.
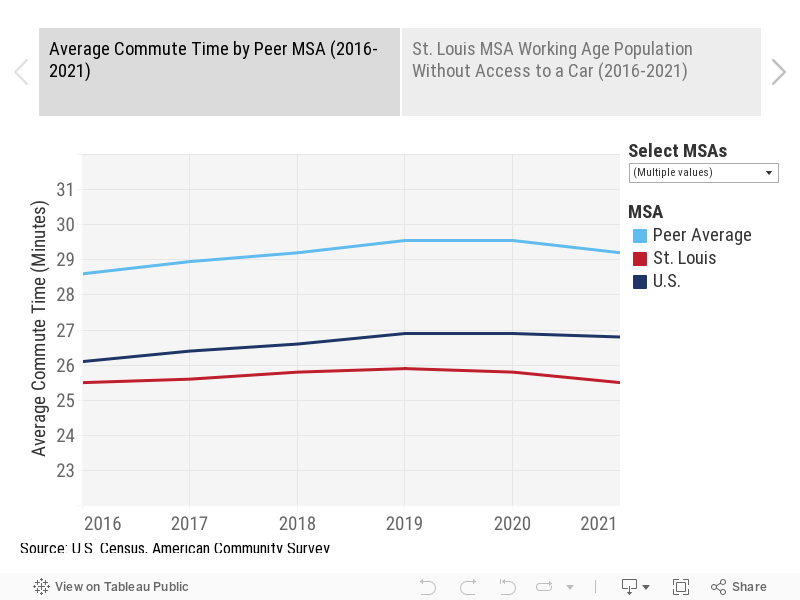
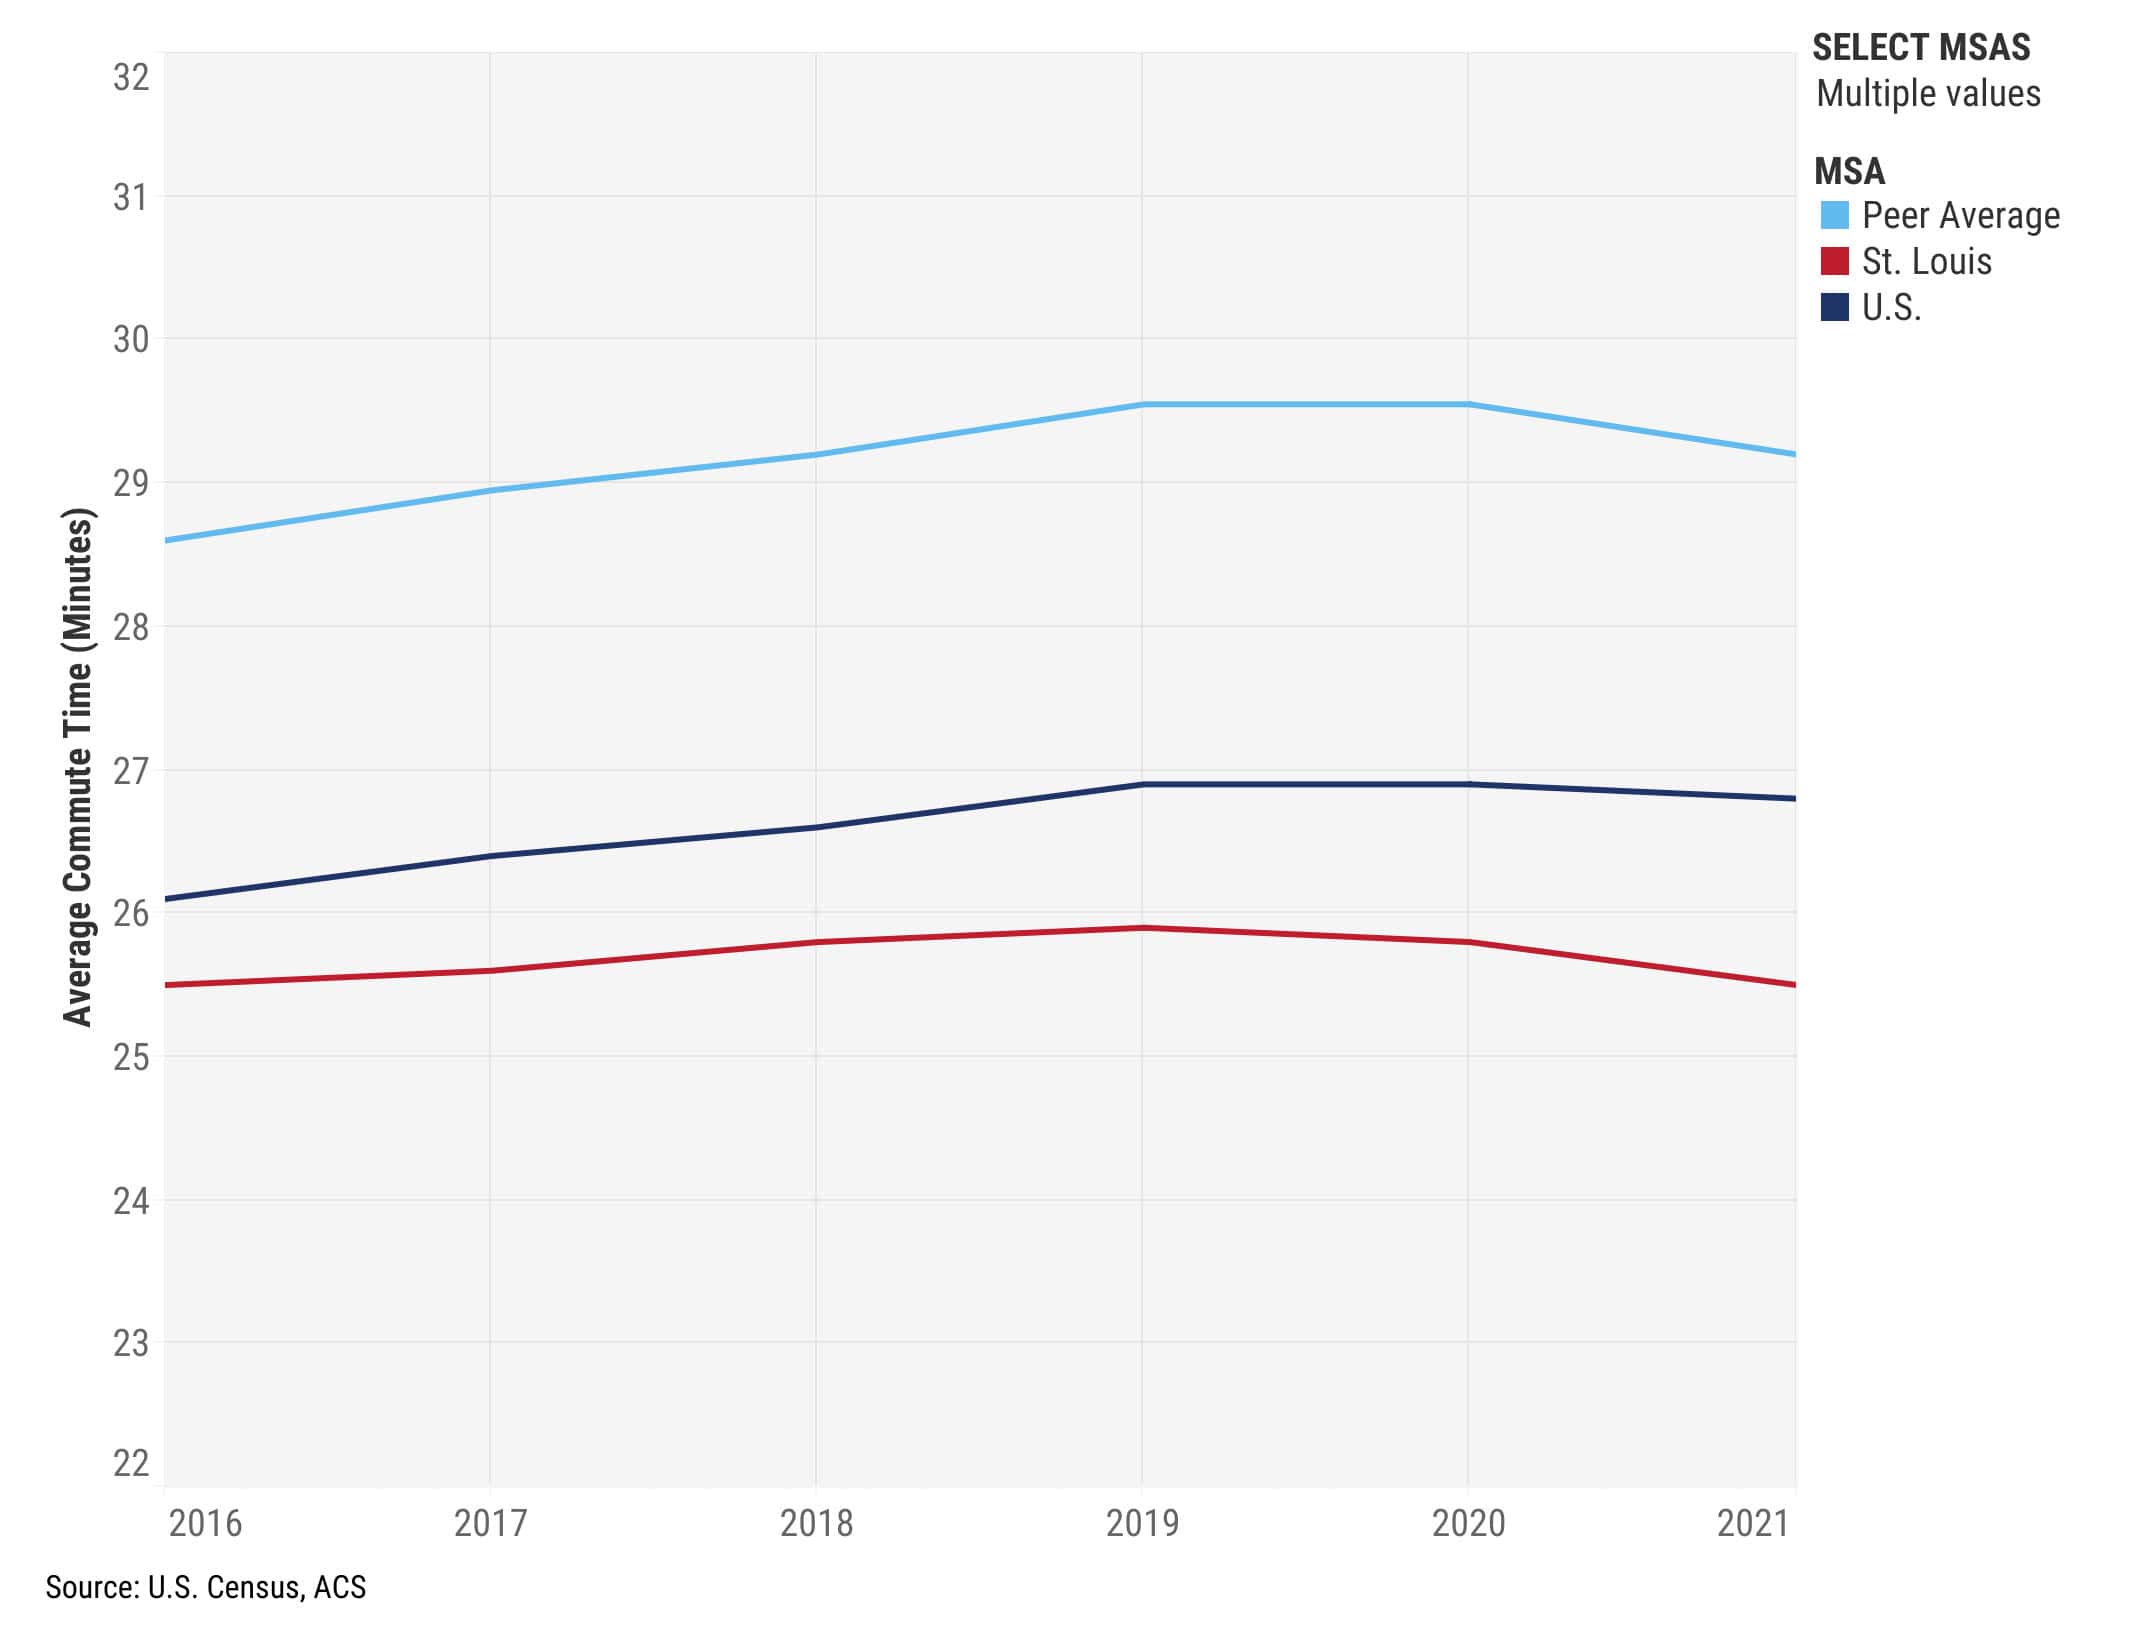
Email Link for LaterReasonable commuting time can bolster employee satisfaction and reduce turnover. Communities benefit when roads are not conjested and public transit is easily accessible and reliable.
Use a desktop device to access a full collection of data.
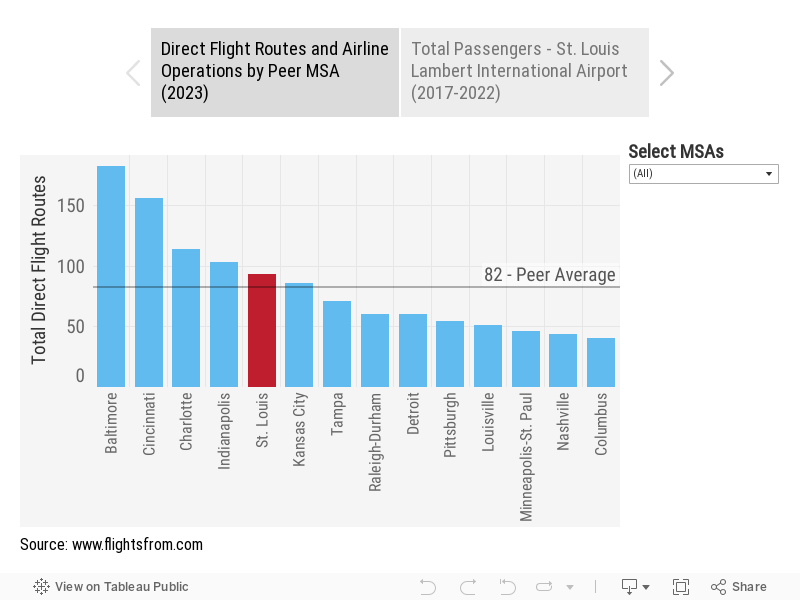
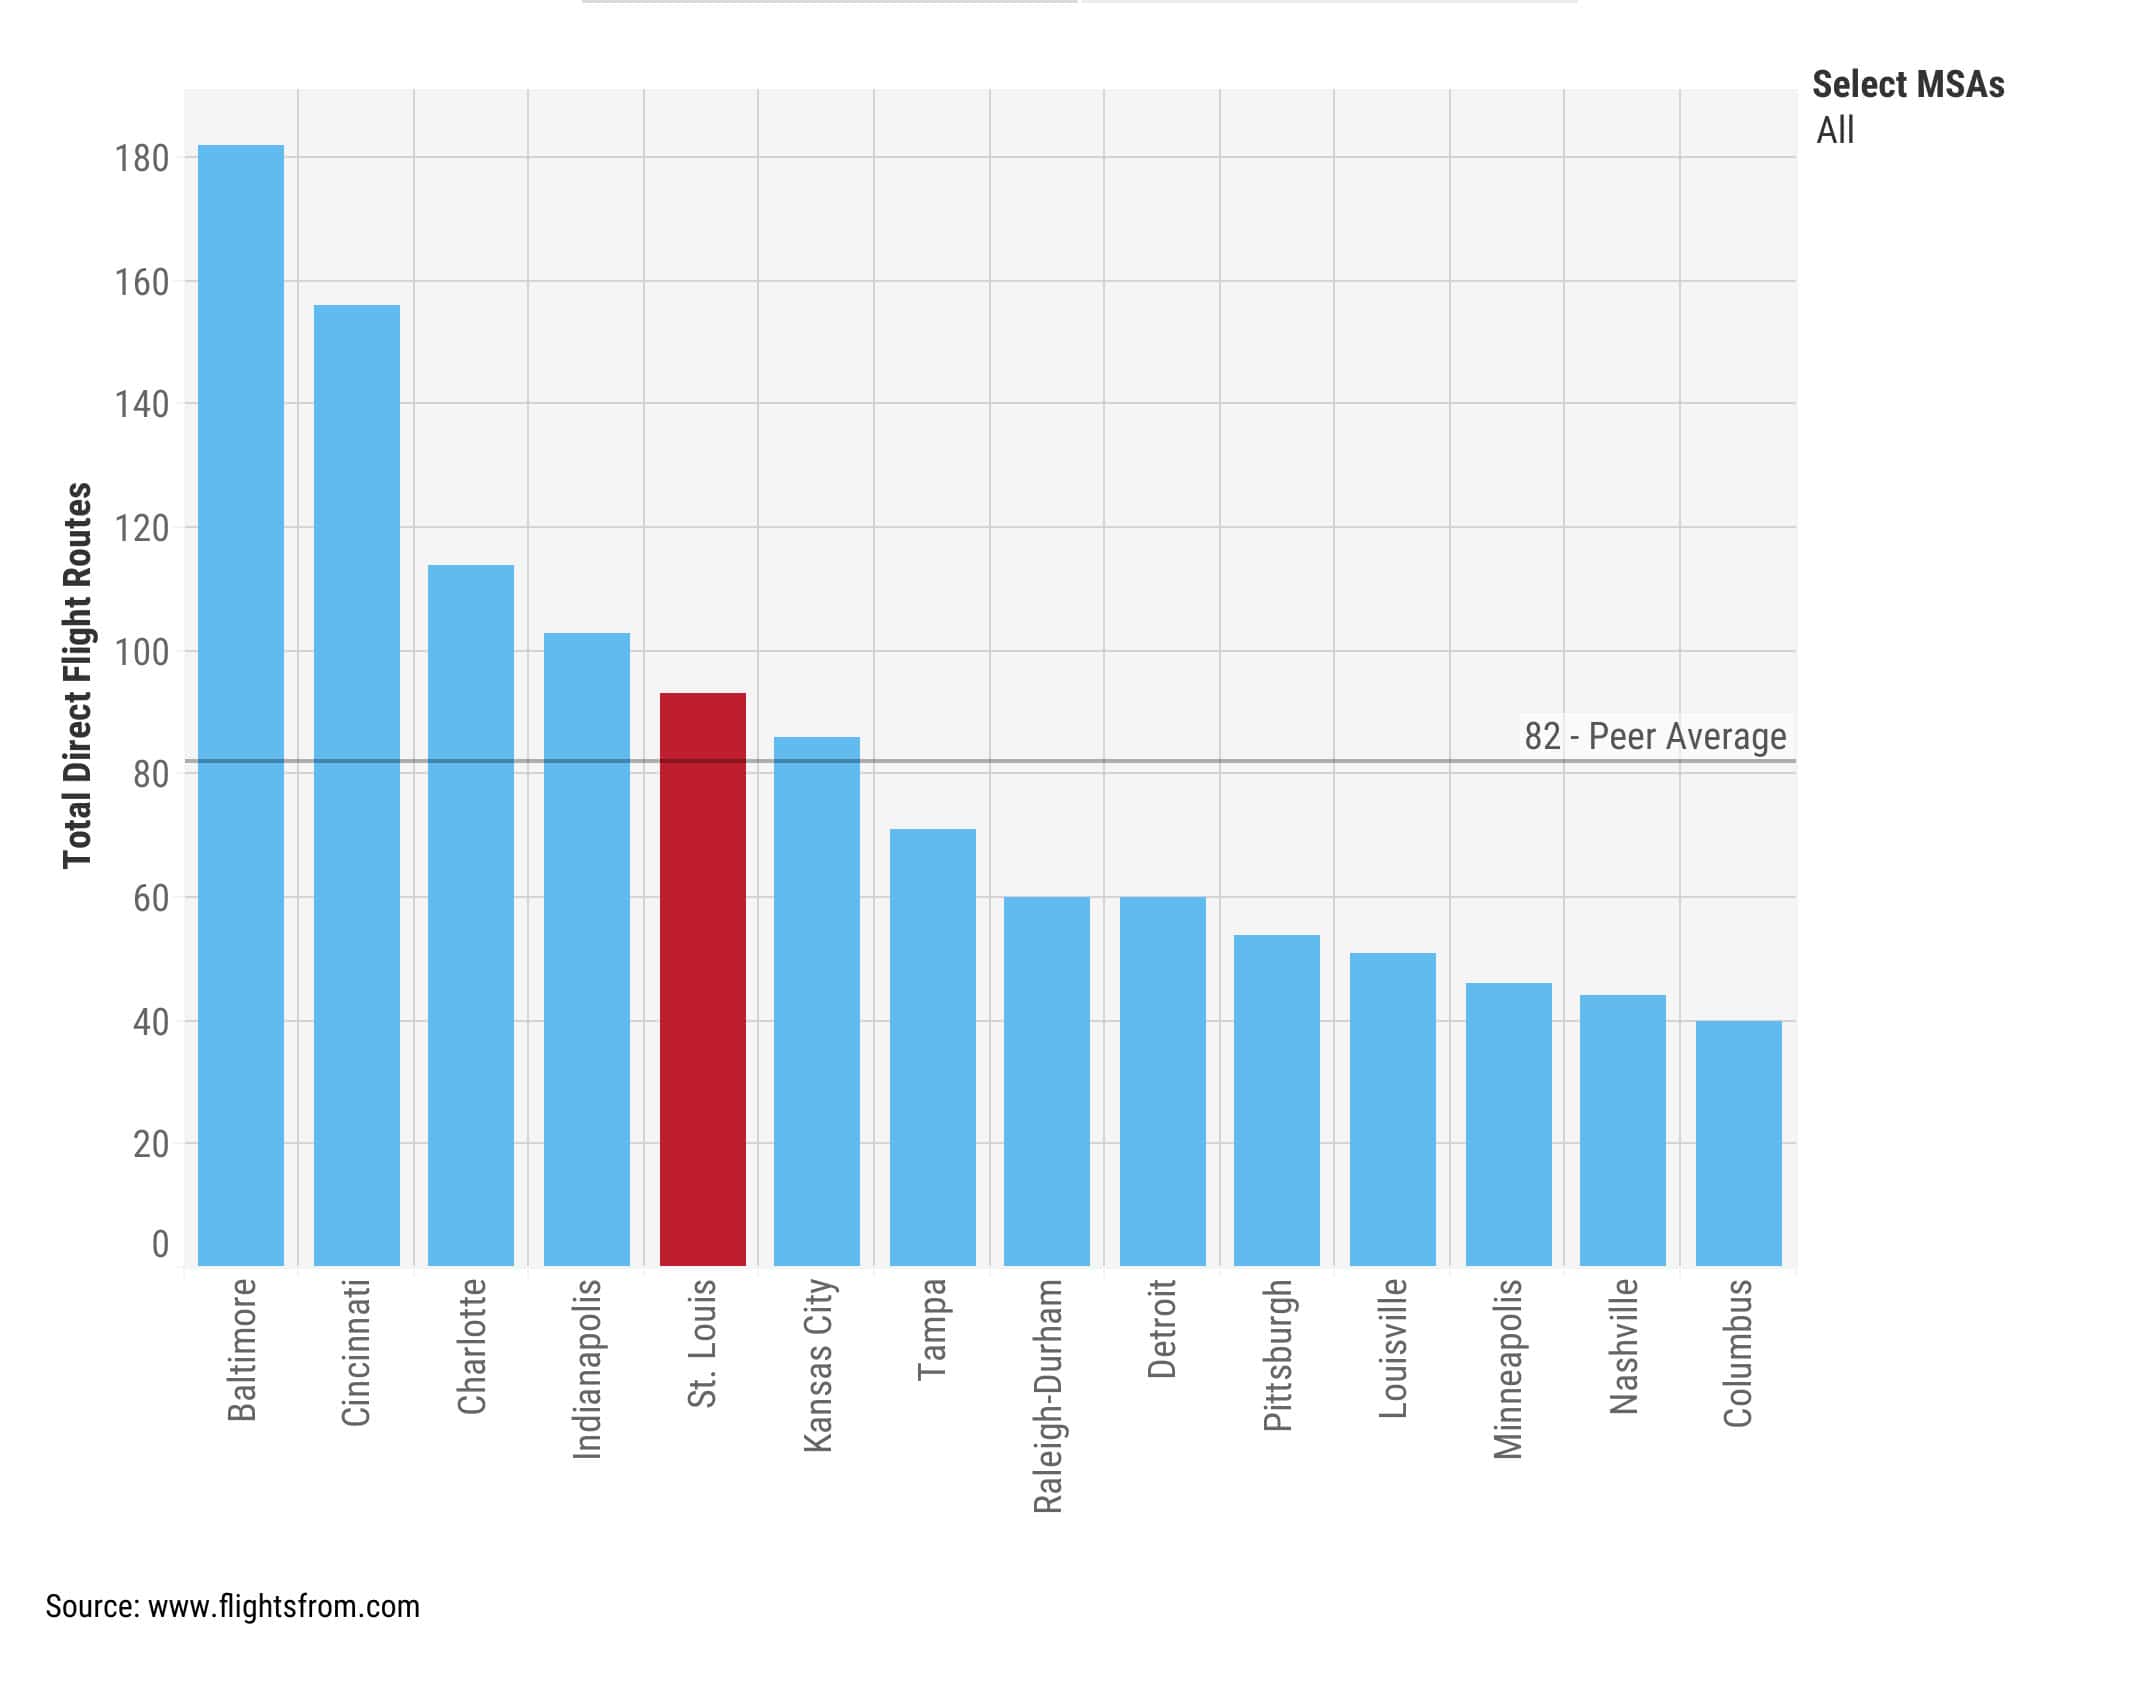
Email Link for LaterAir traffic provides insight into the accessibility and connectivity of the region to national and global hubs, which enables economic growth, tourism, and business attraction and growth.
Use a desktop device to access a full collection of data.
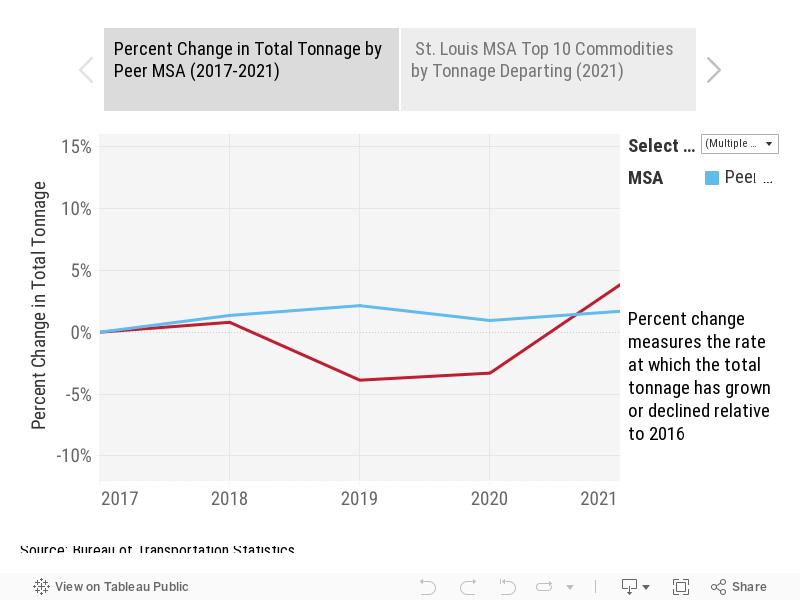
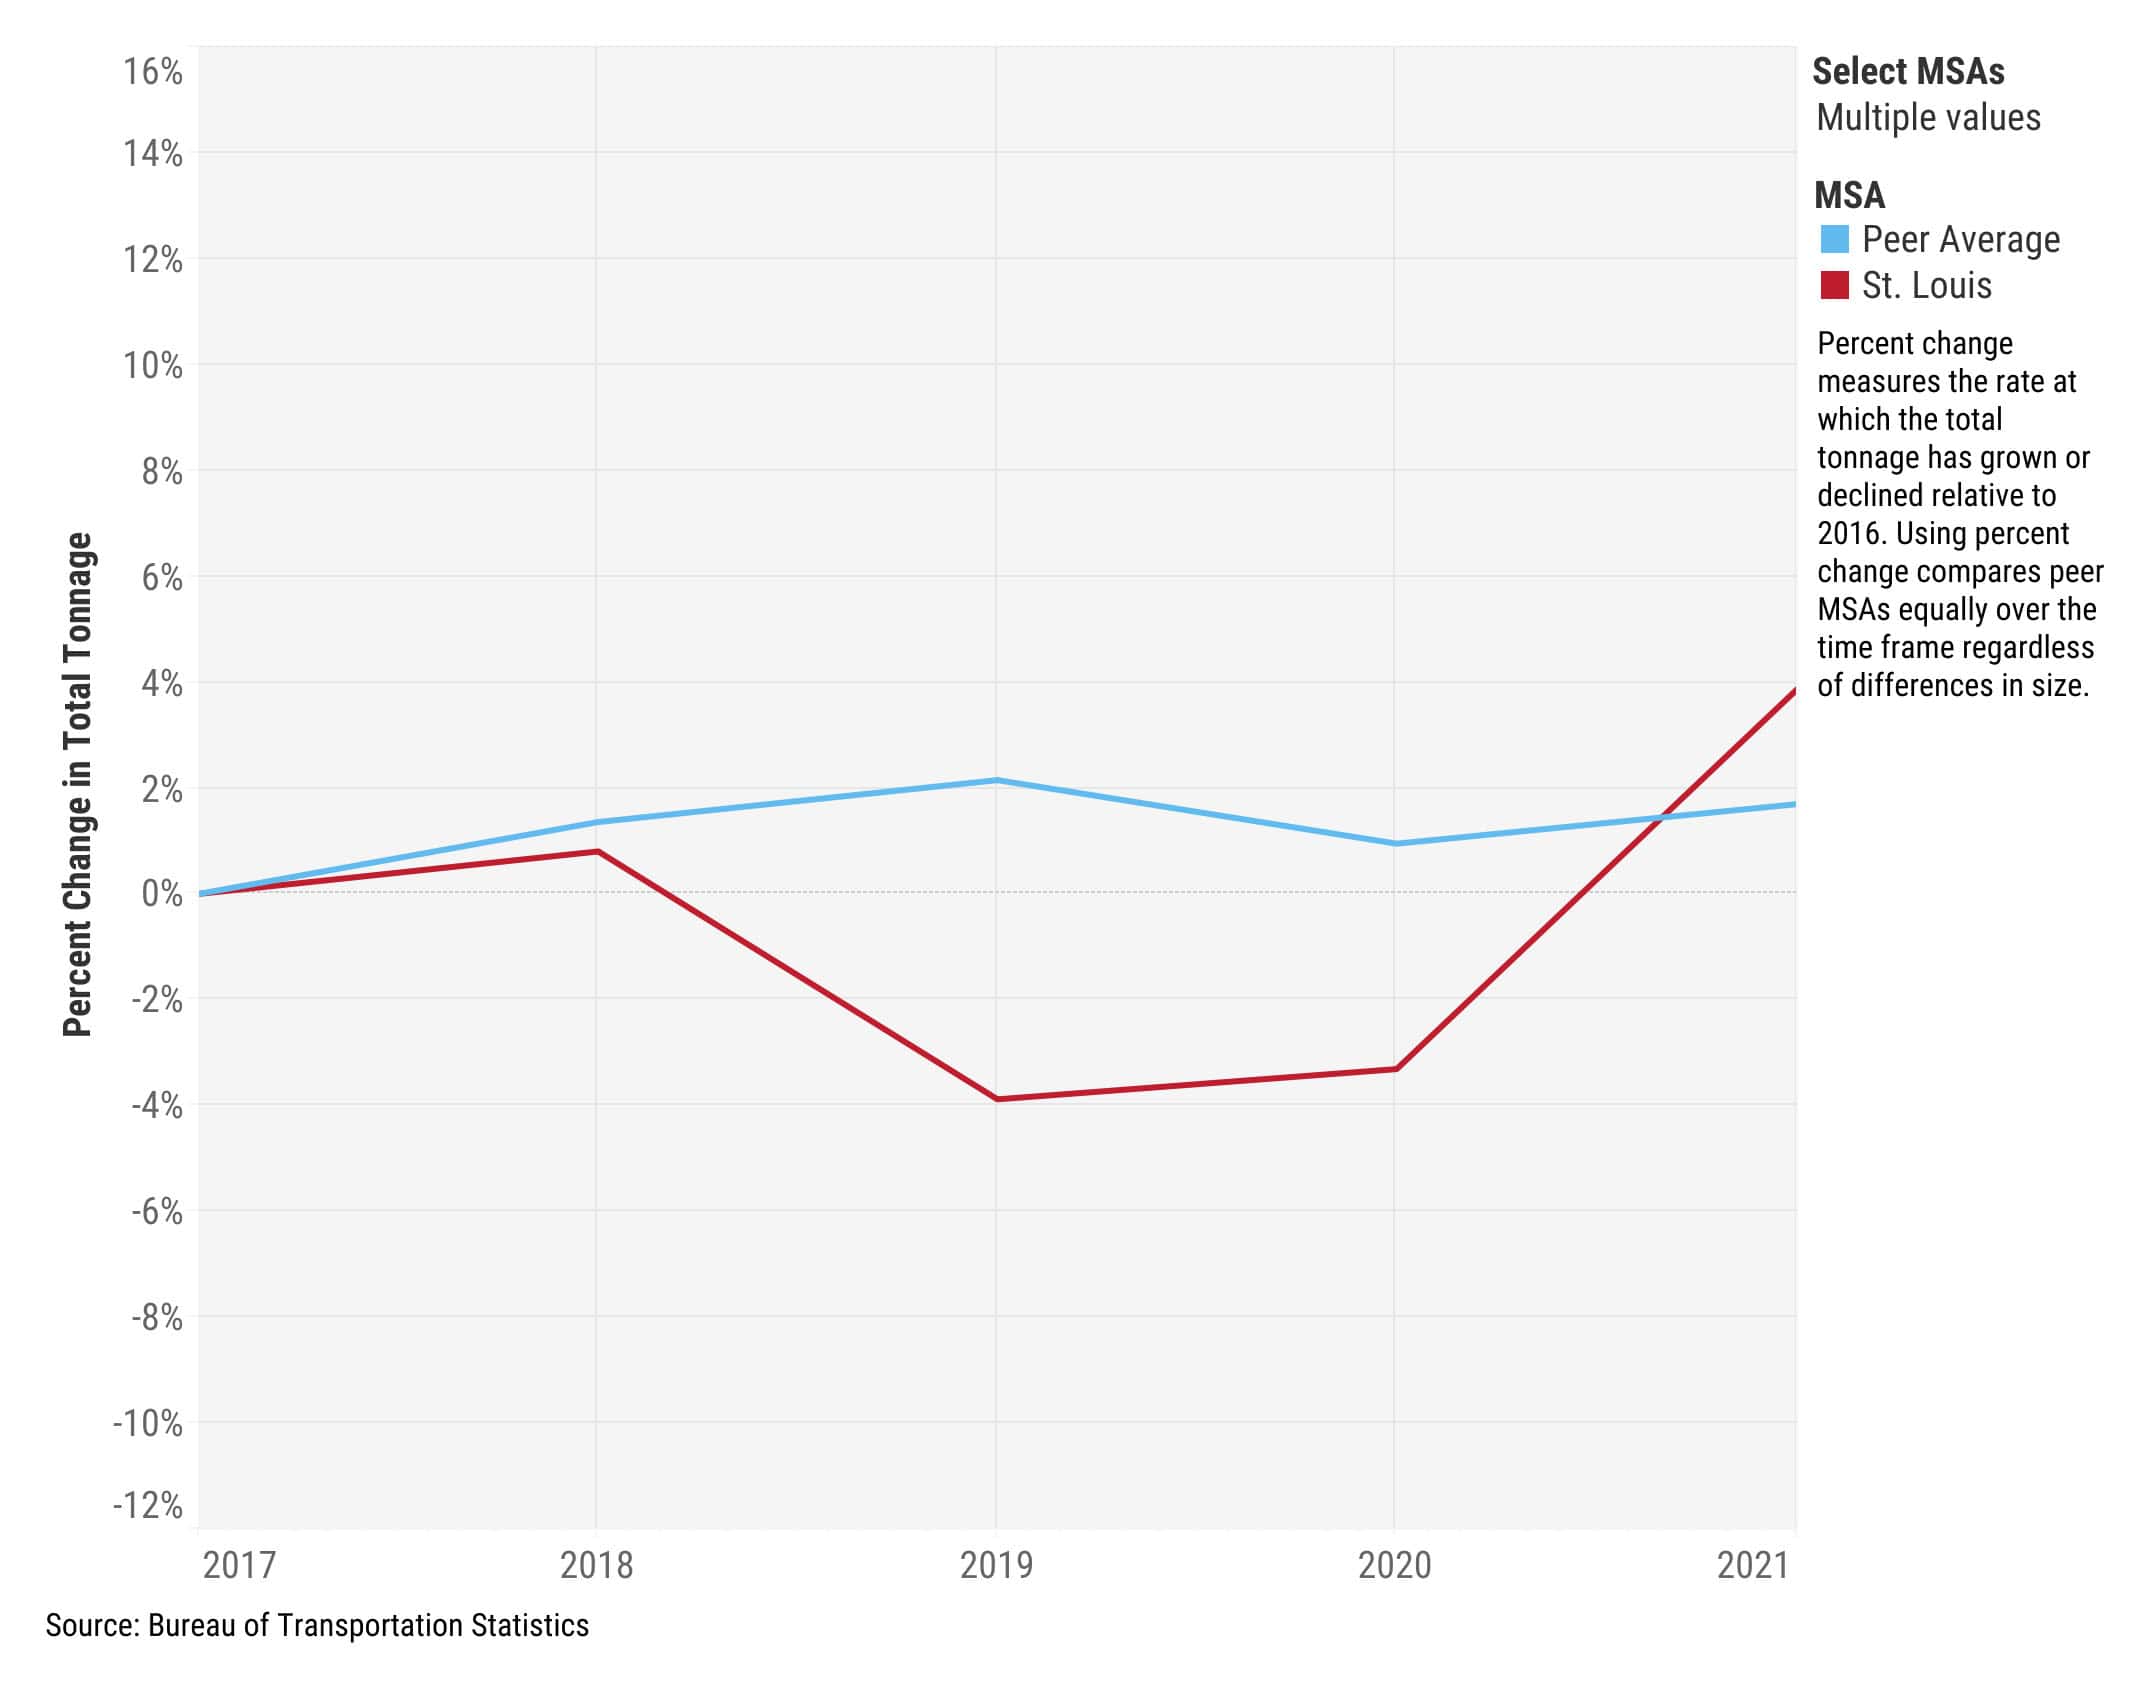
Email Link for LaterTransport of goods to, from, and through the MSA indicates the connectivity of the region’s logistics network and volume of trade.
Use a desktop device to access a full collection of data.
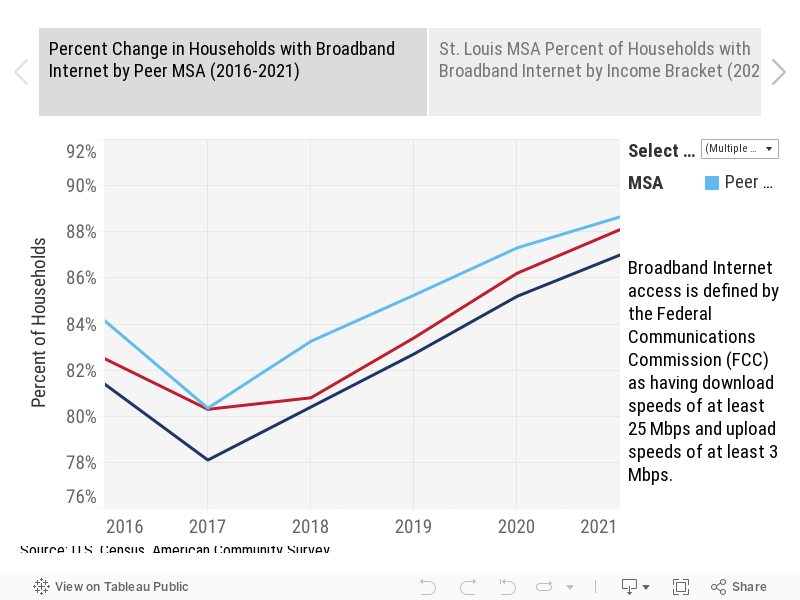
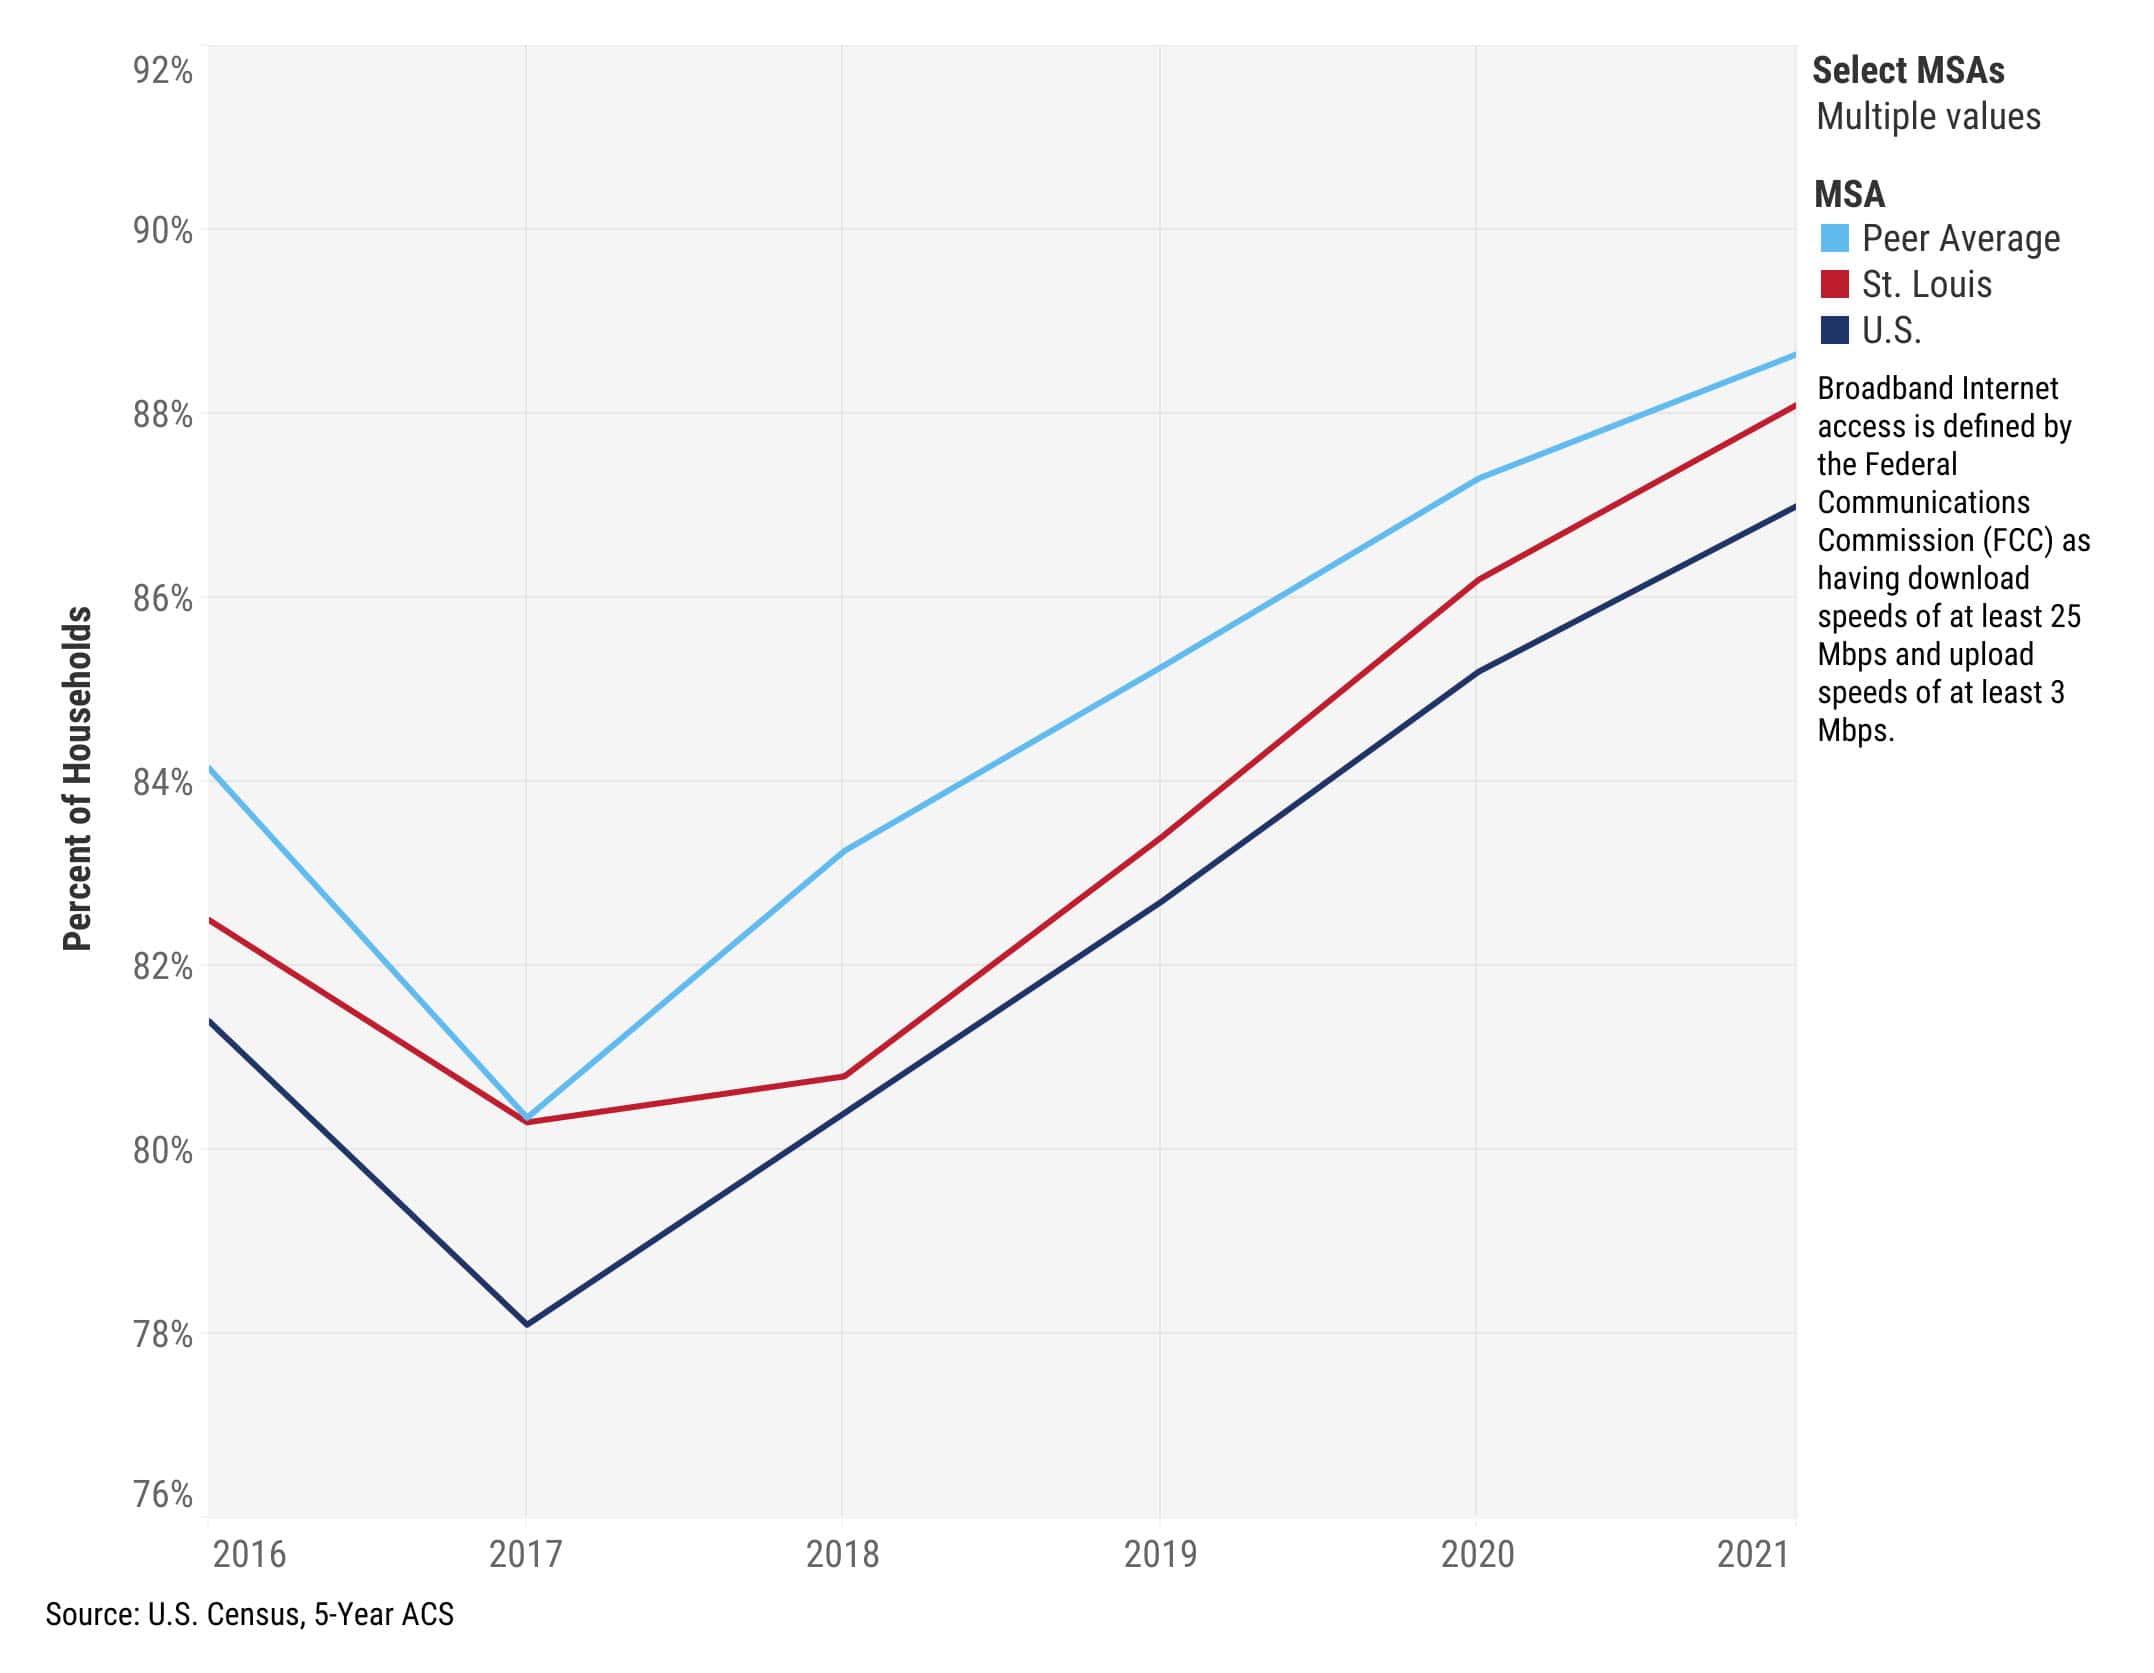
Email Link for LaterBroadband is essential infrastructure that delivers economic benefits to individuals and communities. Internet access and affordability enables social connectivity, workforce participation, and economic opportunity.
Use a desktop device to access a full collection of data.
Email Link for LaterJobs are the pulse of a thriving community. Job growth is a primary tool for measuring economic health. The following views address jobs growth by county and employees, annual wages, and job growth by industry.
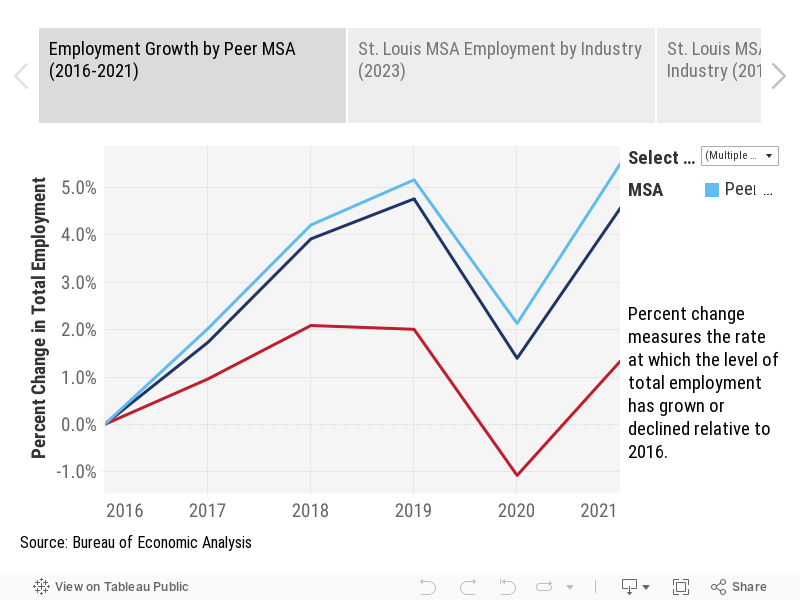
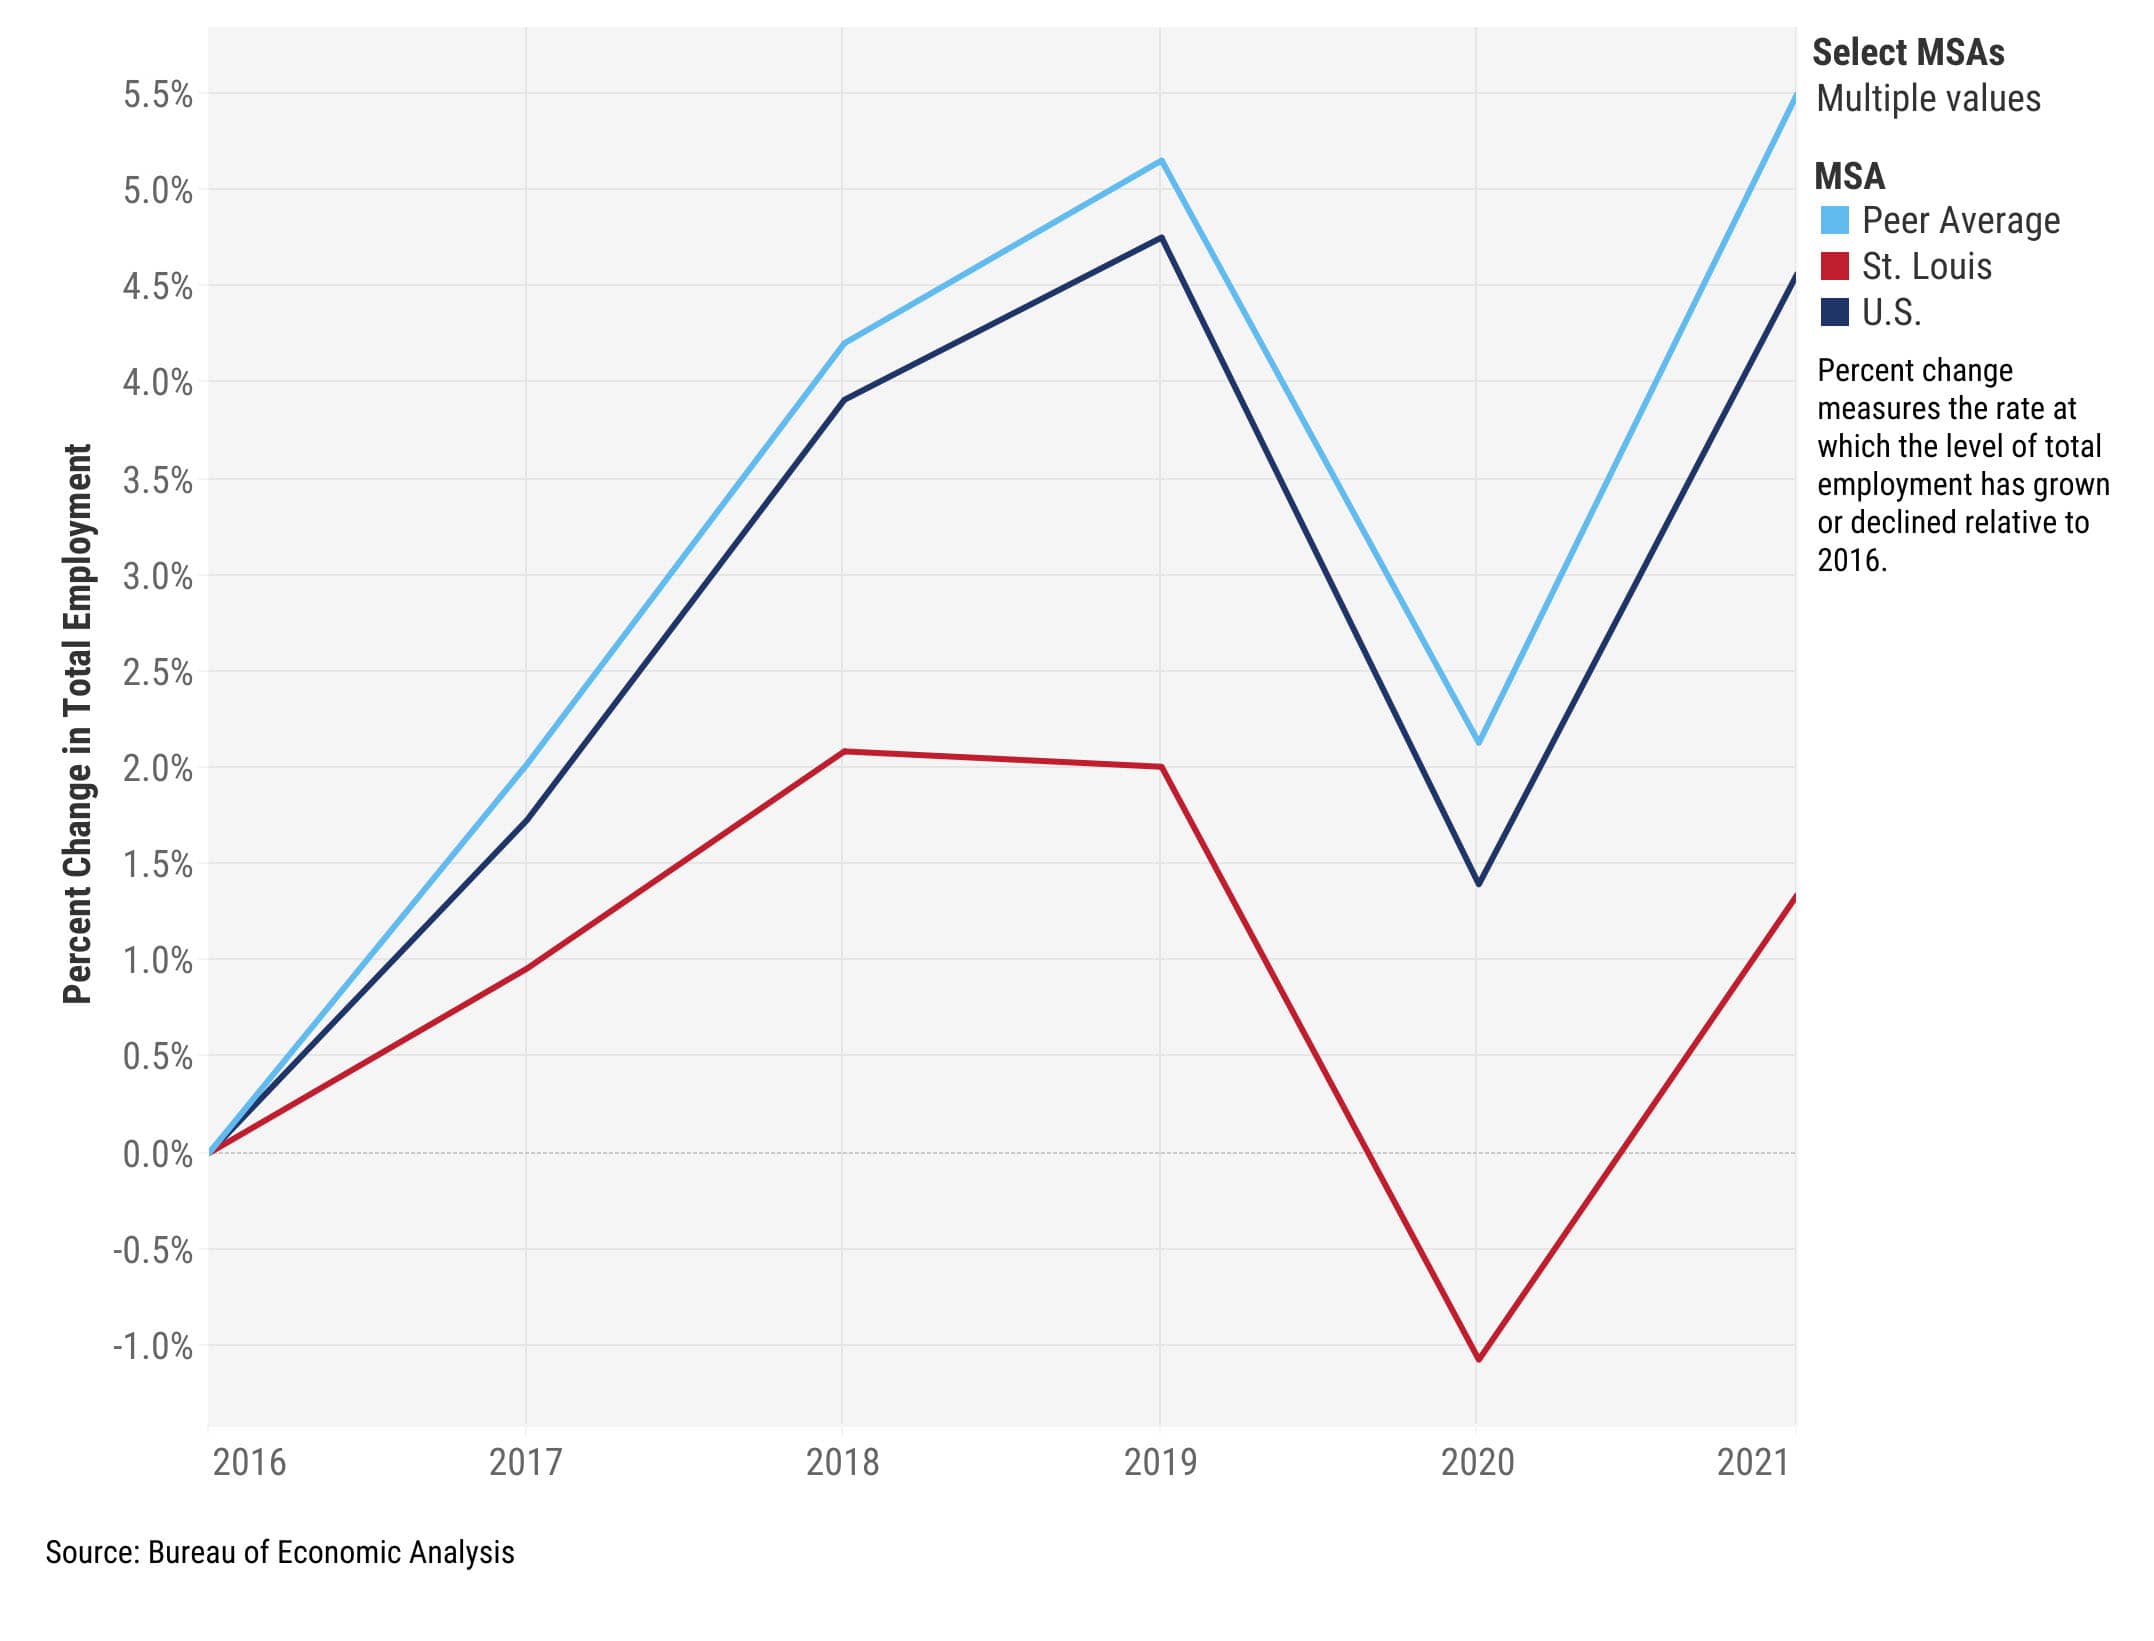
Use a desktop device to access a full collection of data.
Email Link for LaterSt. Louis’ ability to support new small and medium sized business formation and sustain these businesses is fundamental to a vibrant economy.
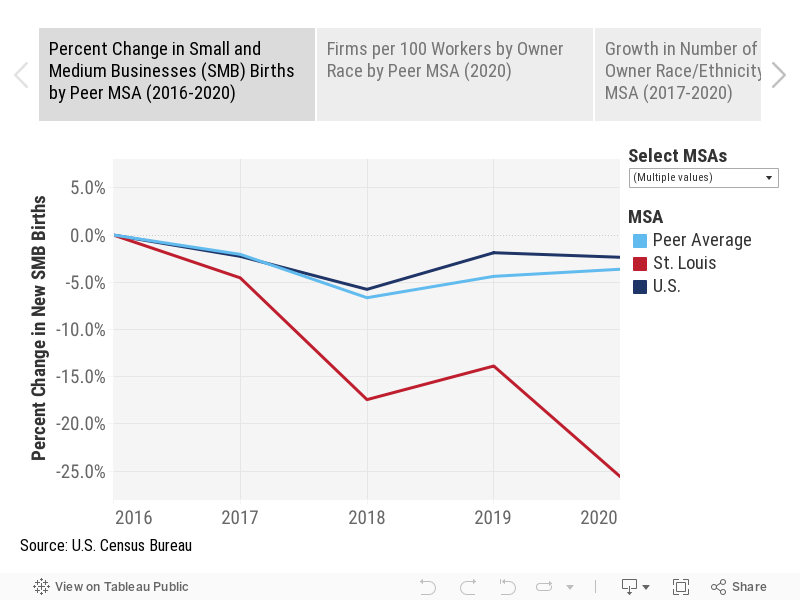
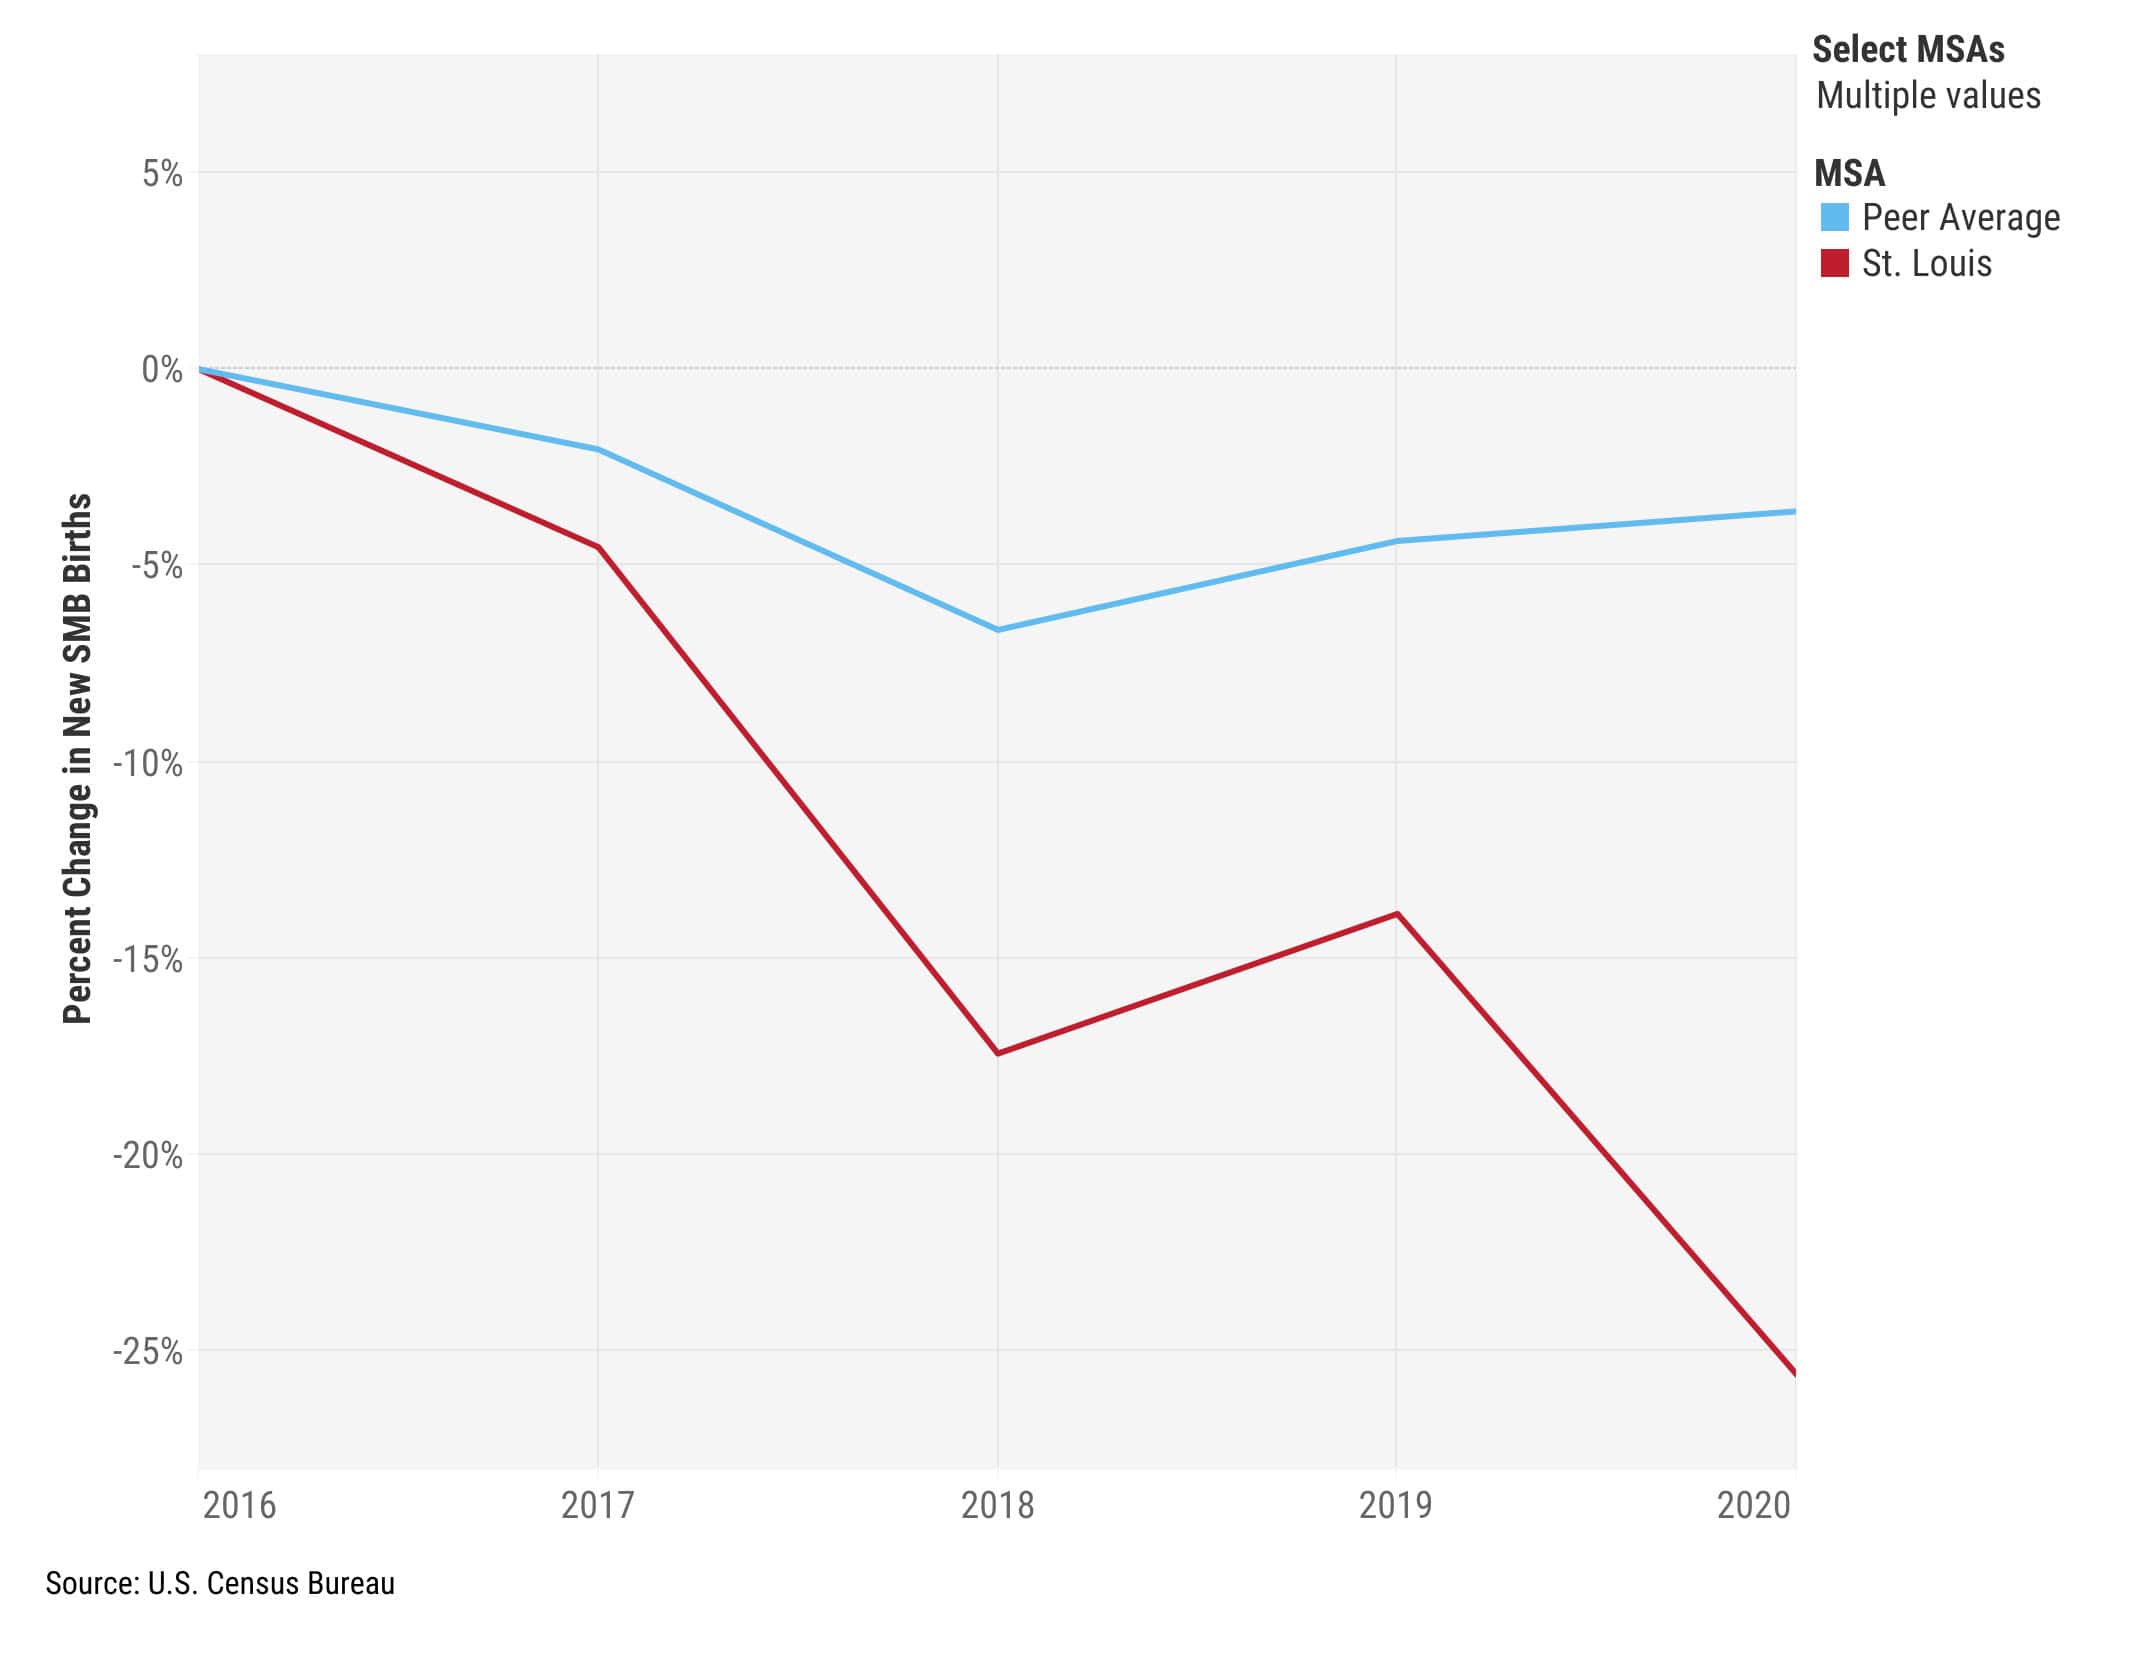
Use a desktop device to access a full collection of data.
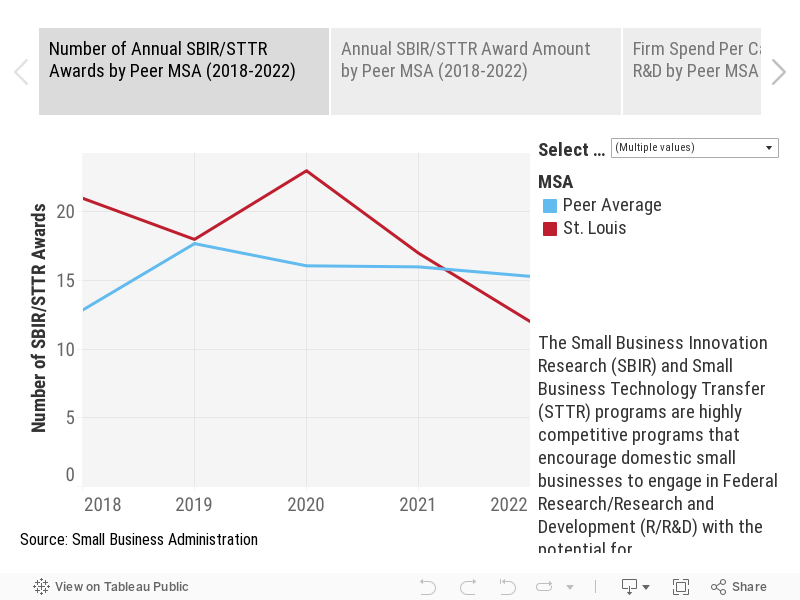
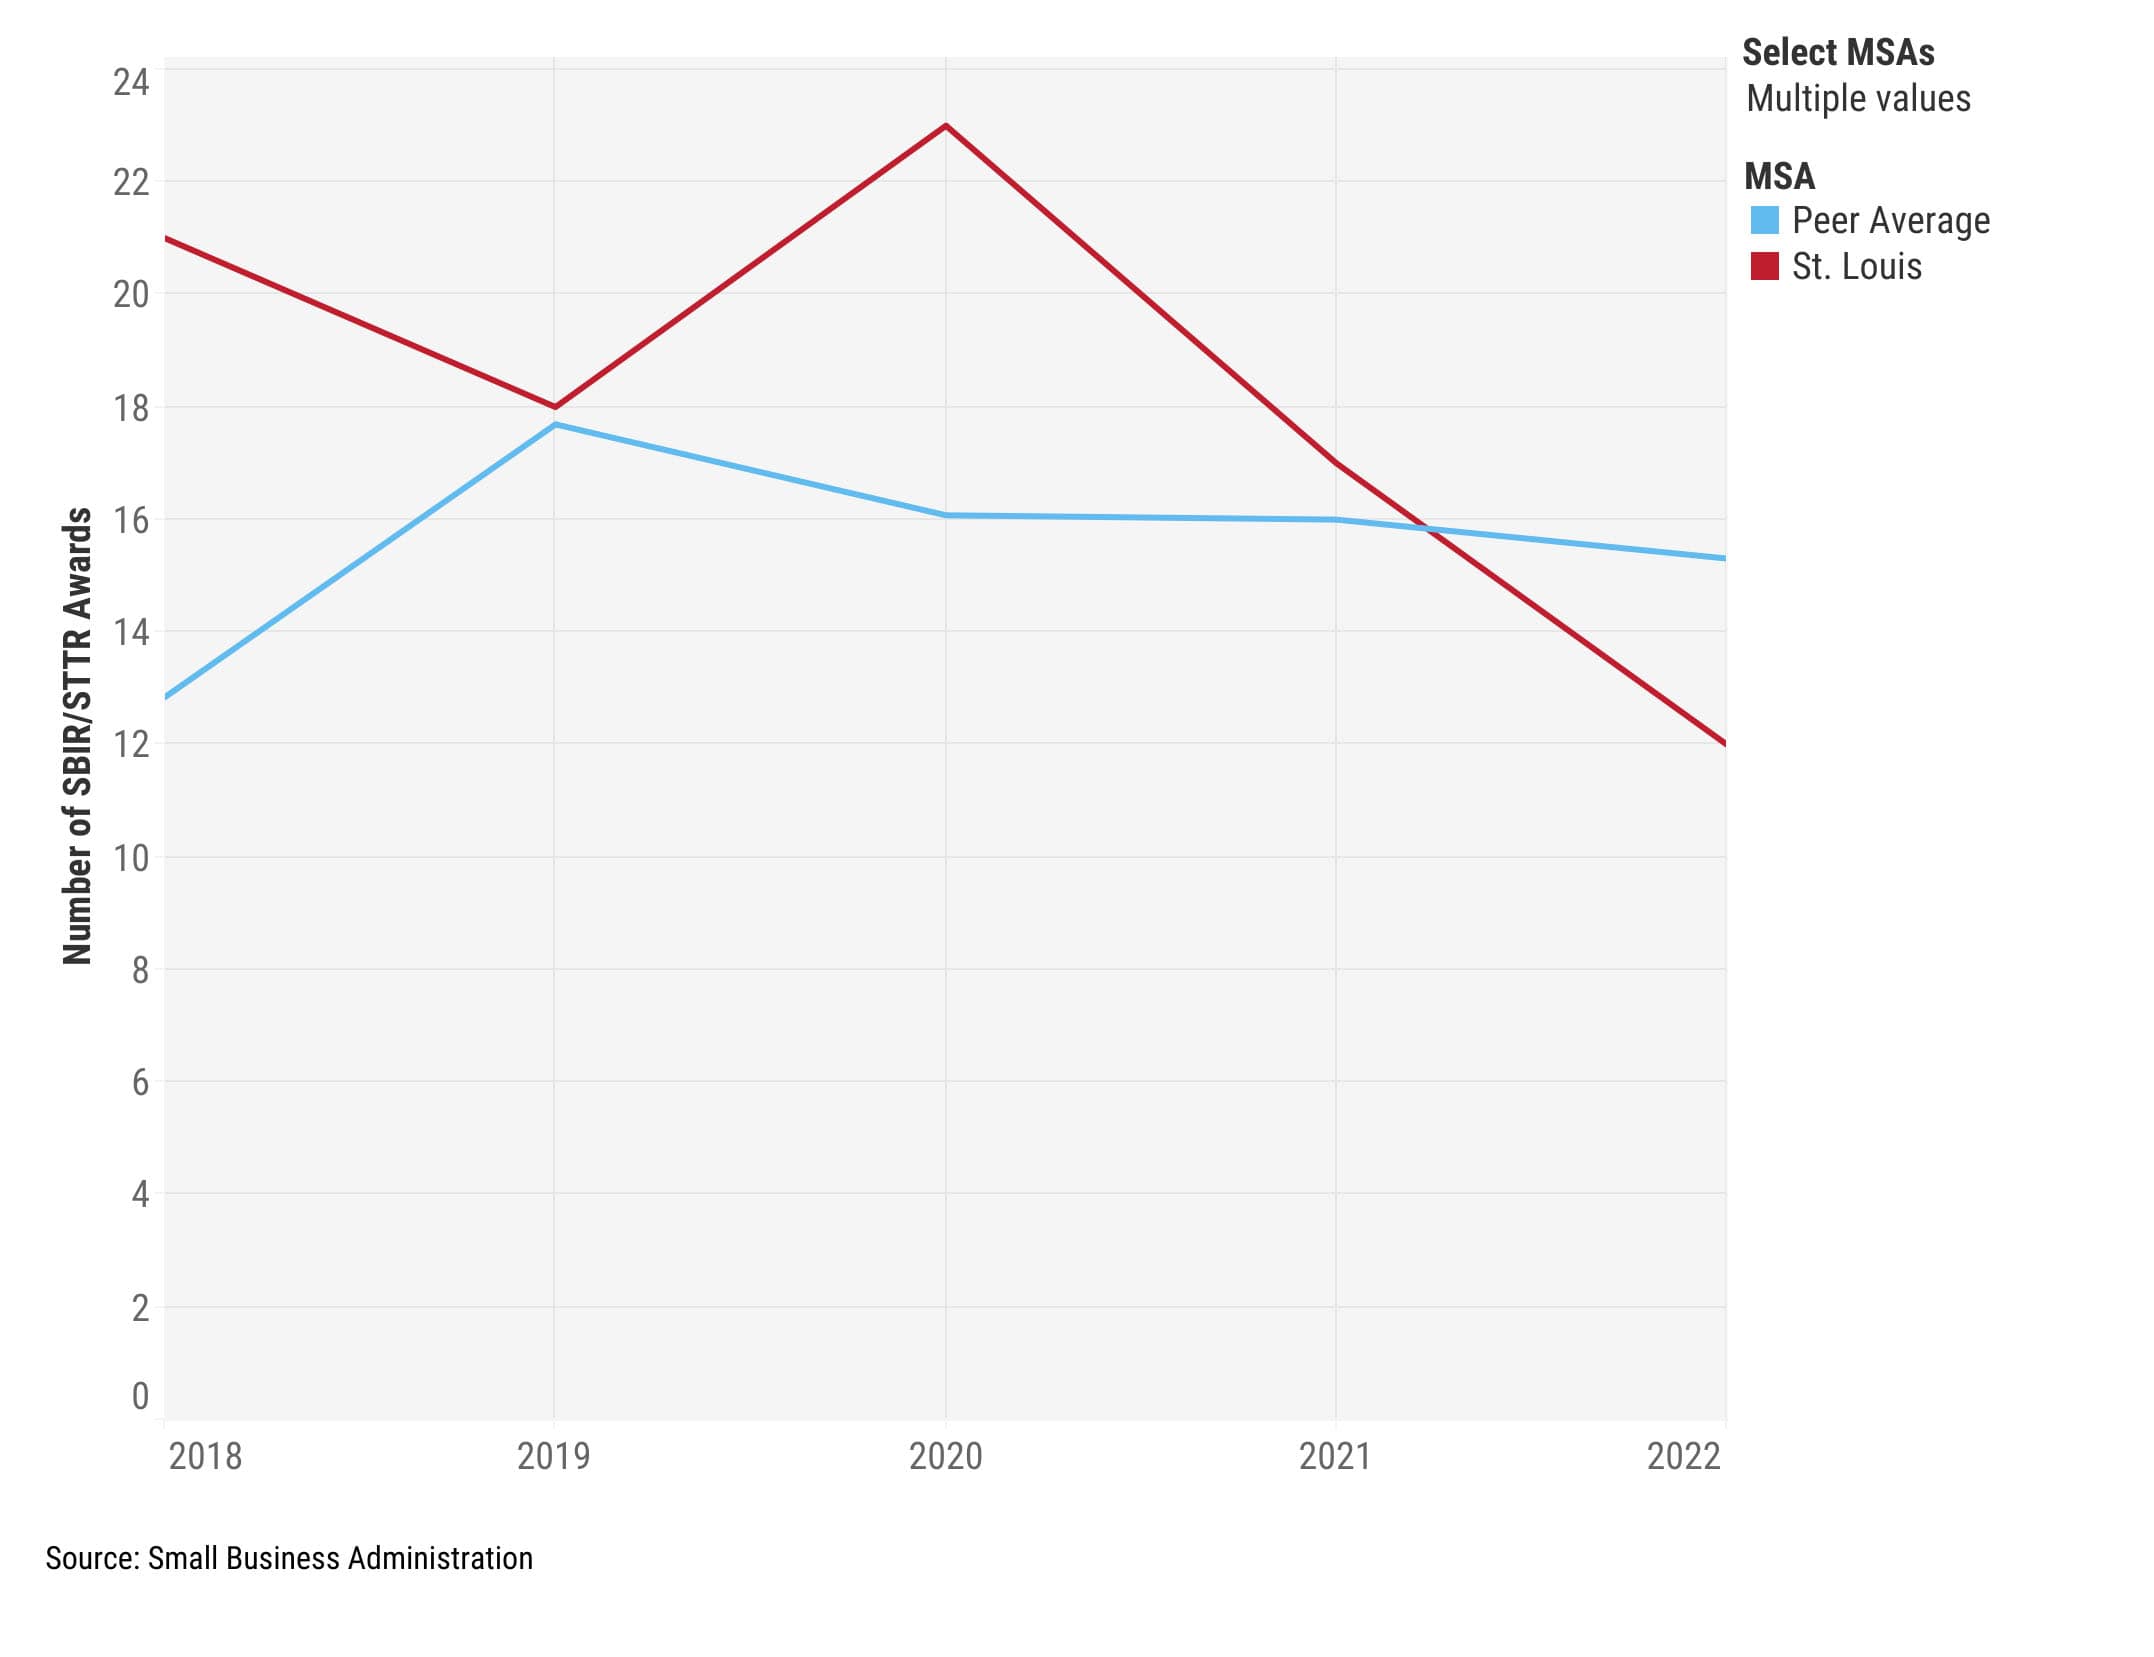
Email Link for LaterResearch and innovation are key to metro success in high tech industries. We track U.S. federal government Small Business Innovation Research (SBIR) and Small Business Technology Transfer (STTR) awards and patents granted.
Use a desktop device to access a full collection of data.
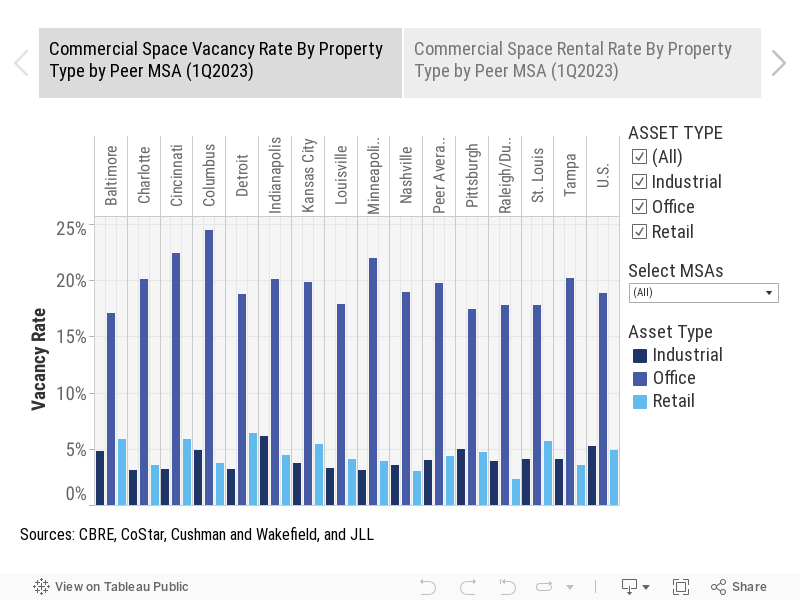
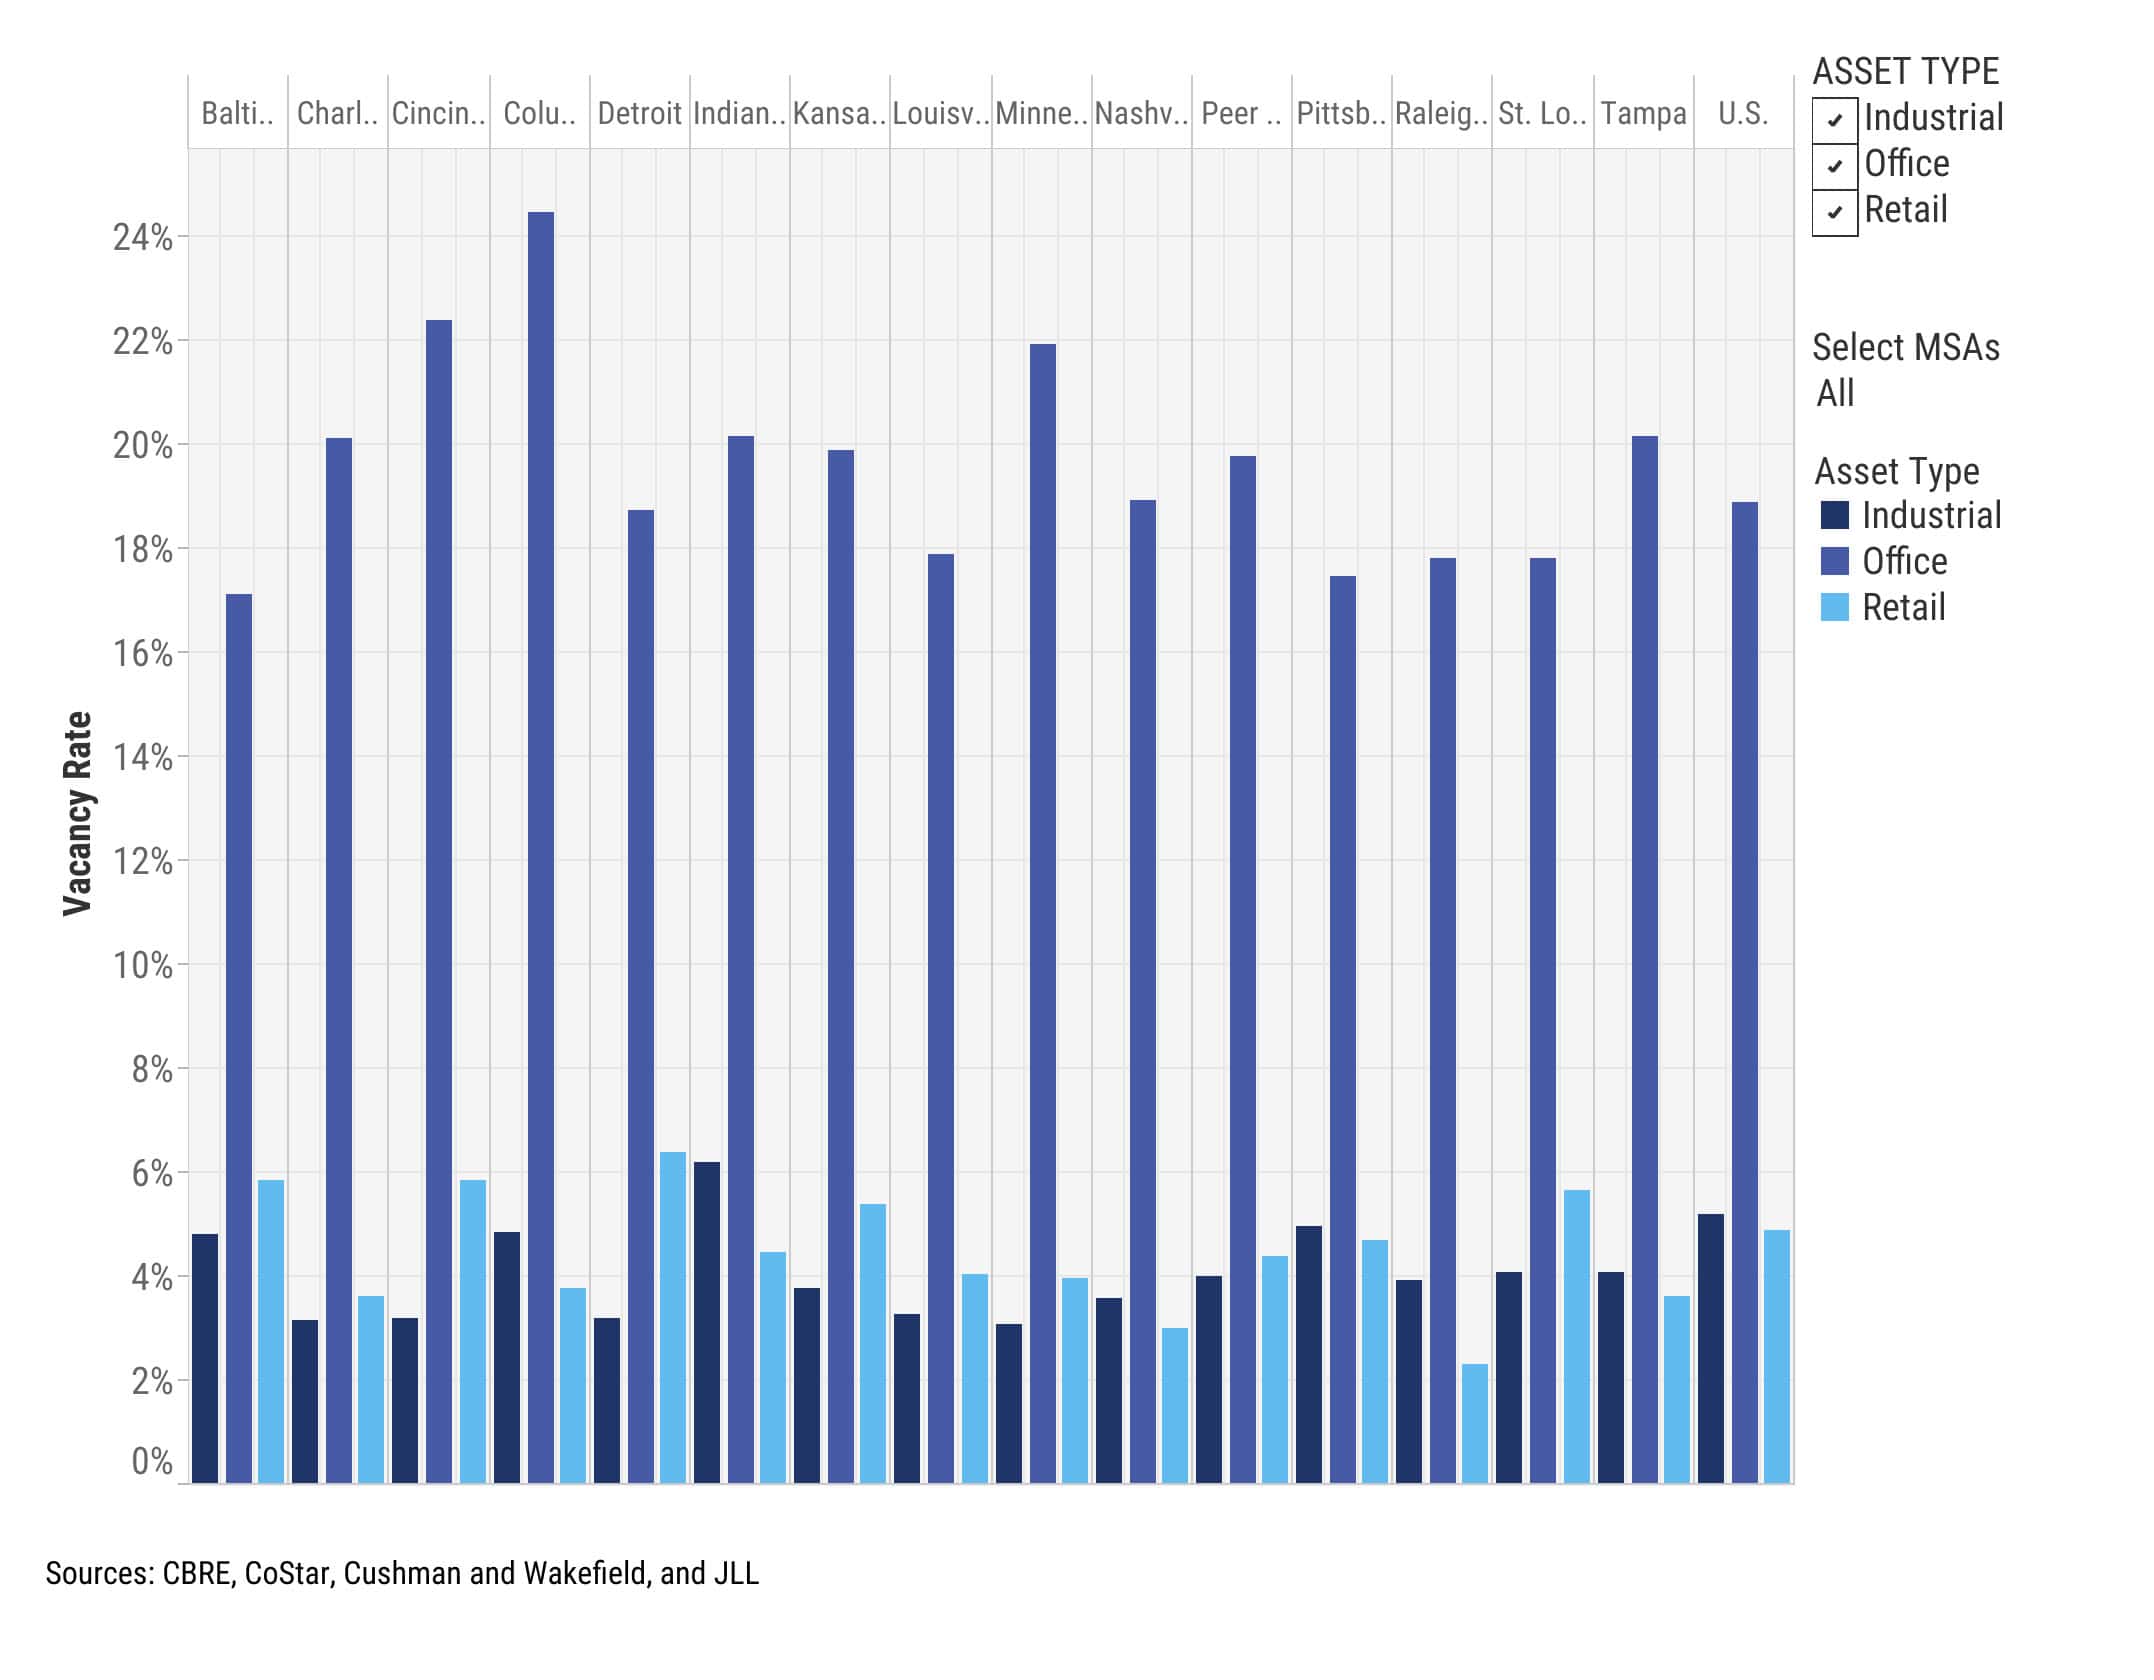
Email Link for LaterThriving commercial markets are a key element of a community’s business environment. Available quality office, industrial, and retail space with competitive rental rates help attract and retain regional employers.
Use a desktop device to access a full collection of data.
Email Link for LaterHomicide is our top regional crime problem. Along with a tragic loss of life, violence impacts business and talent relocation decisions. Reducing violent crime is critical to save lives and advance inclusive economic growth.
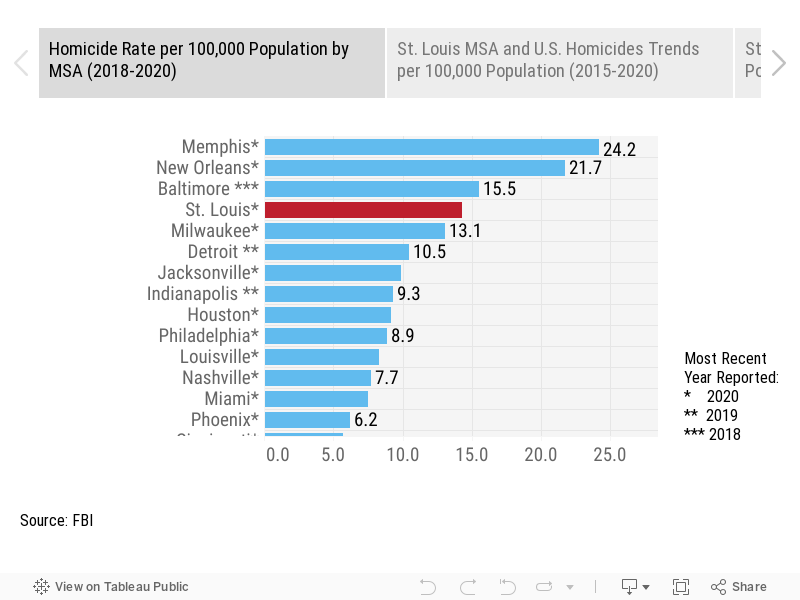
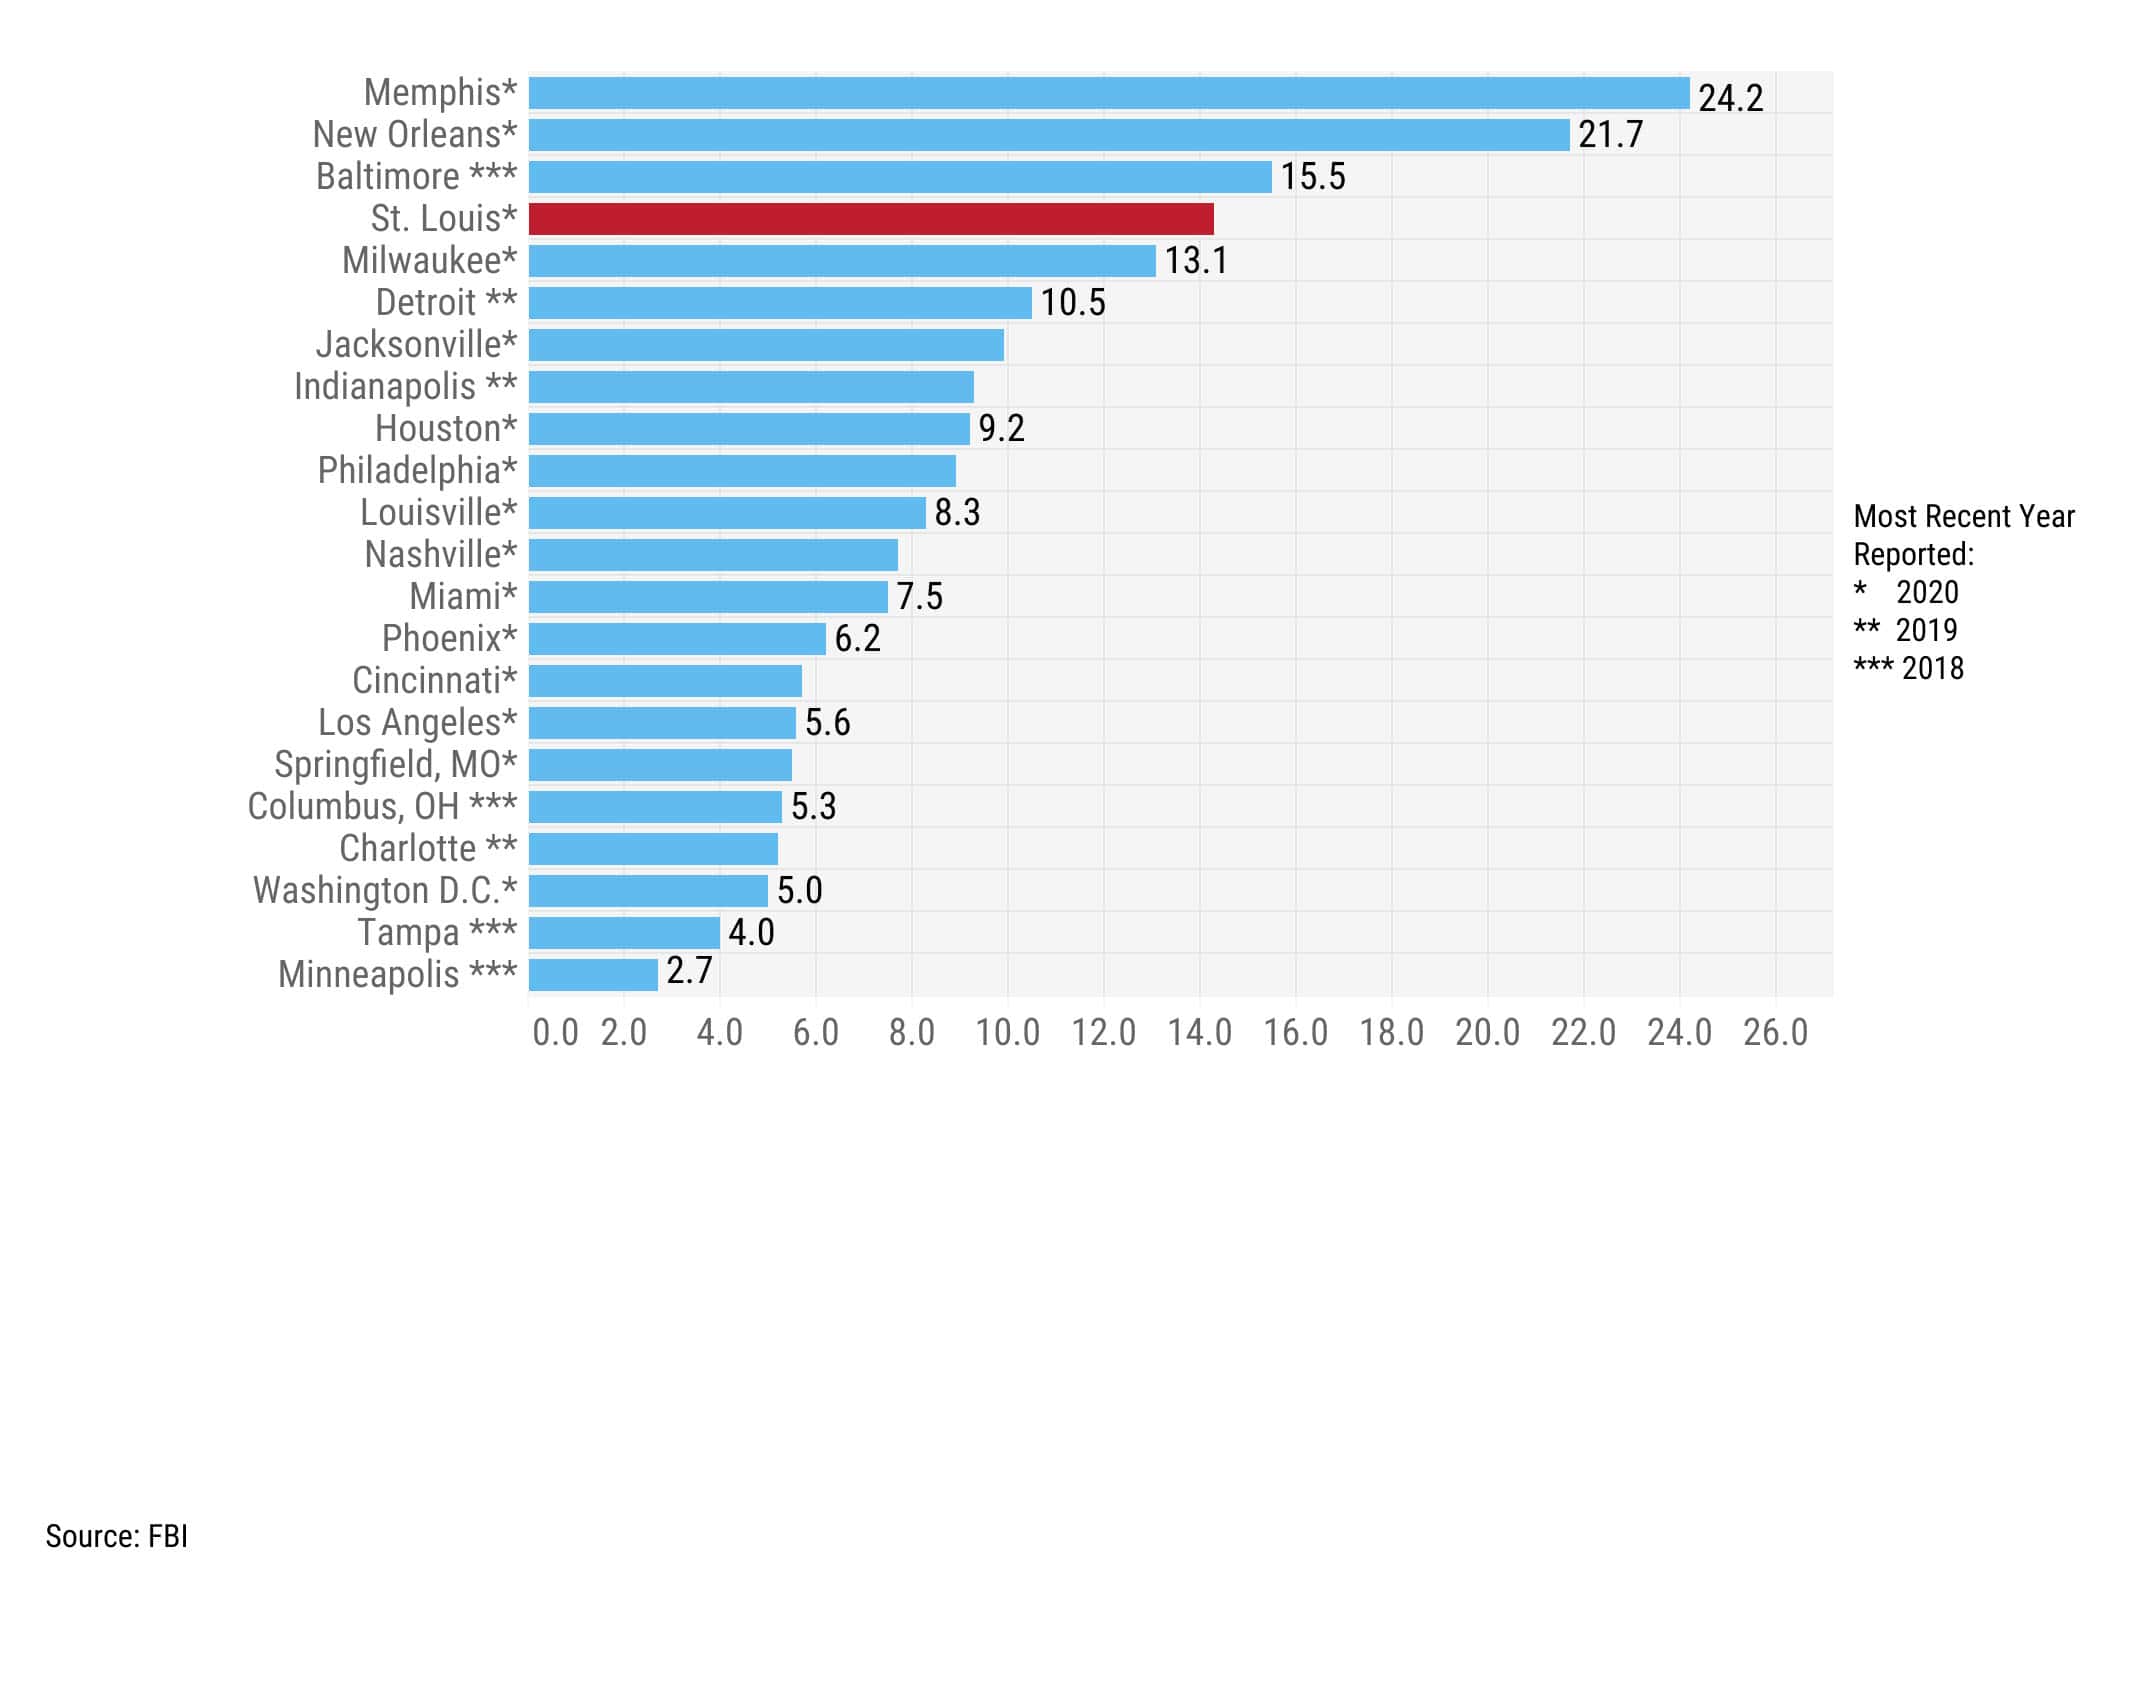
Use a desktop device to access a full collection of data.
Email Link for Later